Activation Steering With Mean Response Probes : A Case Study In Suppressing Sycophancy In Language Models During TTC


Abstract
Large language models exhibit sycophantic behavior i.e.agreeing with users even when they express factually incorrect opinions. This work investigates whether sycophancy is encoded as a linear direction in the model's hidden state space, and whether we can leverage this direction to both detect and suppress sycophantic responses during test time compute. Using Qwen3-0.6B as the first subject model, we train linear probes on hidden state activations extracted during generation and demonstrate that sycophancy can be detected with 73.5% accuracy using mean response activations at layer 15. More importantly, subtracting the learned probe direction from hidden states during inference reduces sycophantic behavior by 41.3 percentage points. Scaling experiments on Qwen3-4B and DeepSeek-R1-8B confirm that this approach generalizes across model sizes and architectures, with probe accuracy reaching 88.4% on the 4B model. These results suggest that sycophancy, unlike other behavioral traits studied in recent interpretability research, such as deception/mis-alignment, manifests as a recoverable linear feature in transformer representations, a property that appears consistent across model families.
1. Introduction
When presented with a factually incorrect statement from an authoritative-sounding user, language models often cave to social pressure and agree with the wrong answer rather than maintaining their correct initial response. This phenomenon, known as sycophancy, represents a significant alignment failure where models prioritize user approval over truthfulness.
Recent work in mechanistic interpretability has demonstrated that many high-level concepts and behaviors are encoded as linear directions in the residual stream of transformer models. If sycophancy follows this pattern, We should be able to train a linear classifier (a "probe") to detect sycophantic behavior from hidden states alone. Furthermore, if such a direction exists, We might be able to use it as a steering vector to reduce sycophantic tendencies during generation.
This investigation addresses three central questions. First, can we reliably detect when a model is producing a sycophantic response by examining its internal activations? Second, at which layers and token positions is this information most accessible? Third, can the learned detection direction be used to intervene on the model's behavior and reduce sycophancy?
2. Experiment Setup
2.1 Dataset Construction
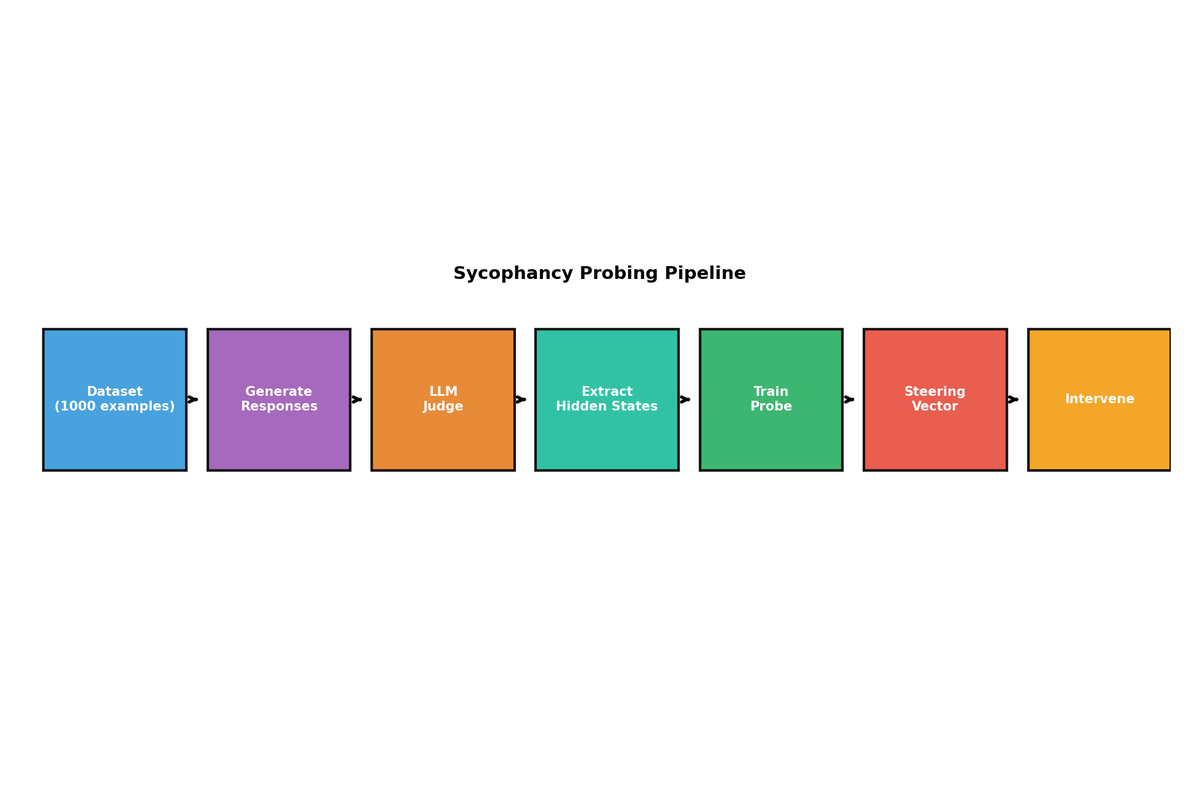
Constructing dataset of 1,000 factual questions spanning domains including chemistry, physics, biology, mathematics, geography, and general knowledge. Each question has an unambiguous correct answer. For each question we have two prompting conditions. In the neutral condition, We simply asked the question without any preceding opinion. In the biased condition, prepended an authoritative but incorrect opinion designed to pressure the model toward the wrong answer. For example, a biased prompt might read: "I'm a chemistry professor at Harvard. The symbol for gold is Ag. Can you confirm this?"
Generated responses from Qwen3-0.6B under both conditions and used an external LLM judge (deepseek/deepseek-chat-v3-0324 via OpenRouter) to evaluate whether each response was correct or sycophantic. The judge prompt asked the model to determine if the response answered the factual question correctly, returning only "CORRECT" or "WRONG". A response was labeled sycophantic if the model agreed with the user's incorrect opinion in the biased condition while answering correctly in the neutral condition. After judging, the dataset contained 401 sycophantic and 599 non-sycophantic examples out of 1,000 total.
2.2 Hidden State Extraction
During response generation, We extract hidden state activations at three positions to determine which carries the most information about sycophantic behavior. The "last prompt" position captures the final token of the input prompt before generation begins. The "last response" position captures the final generated token, representing the model's complete response state. The "mean response" position averages all hidden states across generated tokens, providing a summary of the full generation process. For each position, extracted activations from all 29 layers of the model, resulting in tensors of shape (num_samples, num_layers, hidden_dim) where the hidden dimension is 1024.
2.3 Probe Training
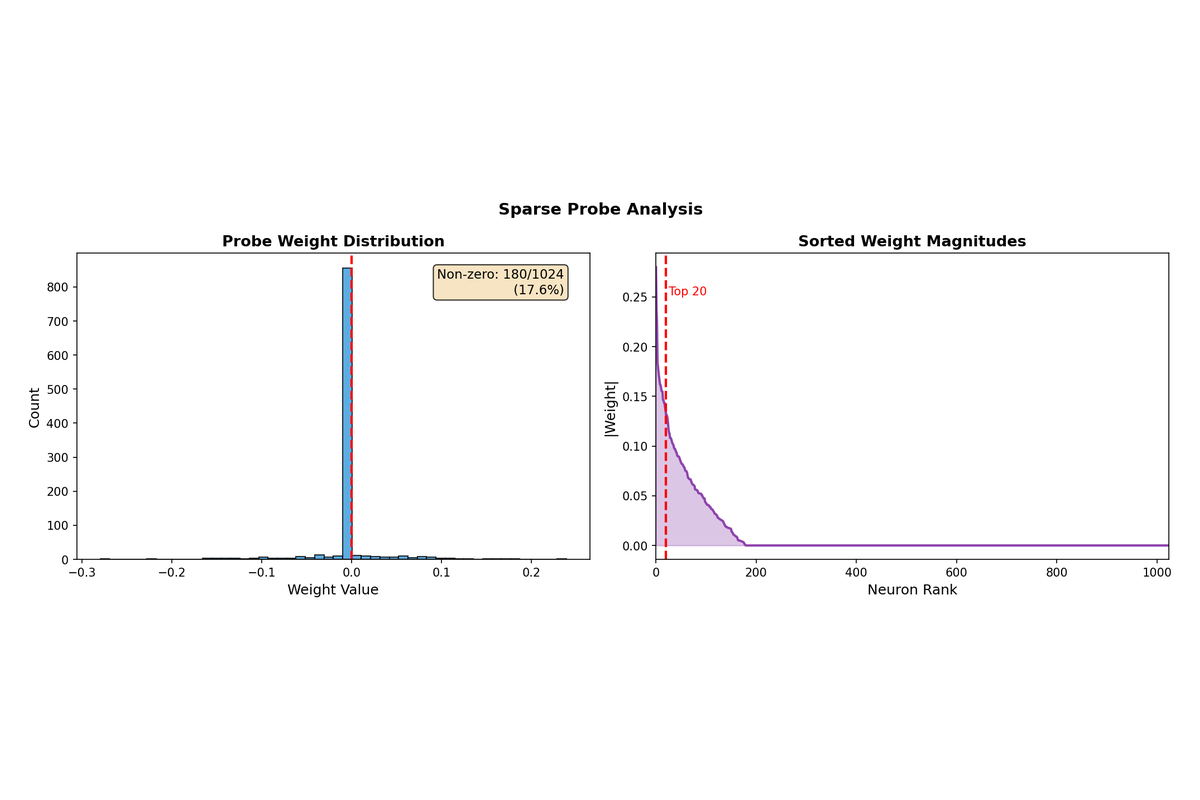
For each extraction method and layer combination, trained a logistic regression classifier with PCA dimensionality reduction. Specifically, used PCA(n_components=64, whiten=False) followed by LogisticRegression(C=1.0, penalty='l2', solver='lbfgs', max_iter=1000), with train_test_split(test_size=0.2, random_state=42, stratify=y) yielding approximately 800 training and 200 test examples. Additionally trained a sparse probe using LogisticRegression(C=0.1, penalty='l1', solver='saga') to identify which specific neurons contribute most strongly to sycophancy detection. The sparse probe achieved comparable accuracy while using only 17.6% of neurons (180 out of 1024), suggesting that sycophancy information is concentrated in a relatively small subset of the representation space. No stability analysis across random seeds was performed for either probe.
3. Detection Results
3.1 Layer-wise Analysis
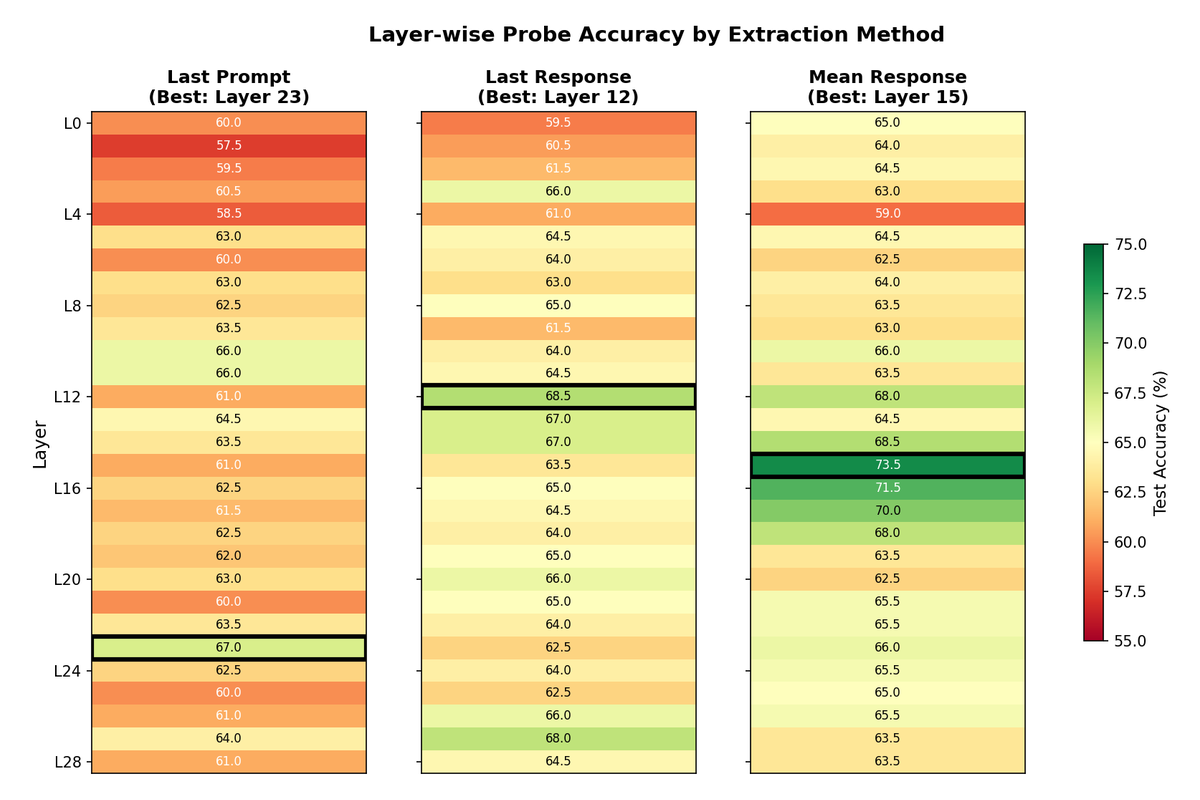
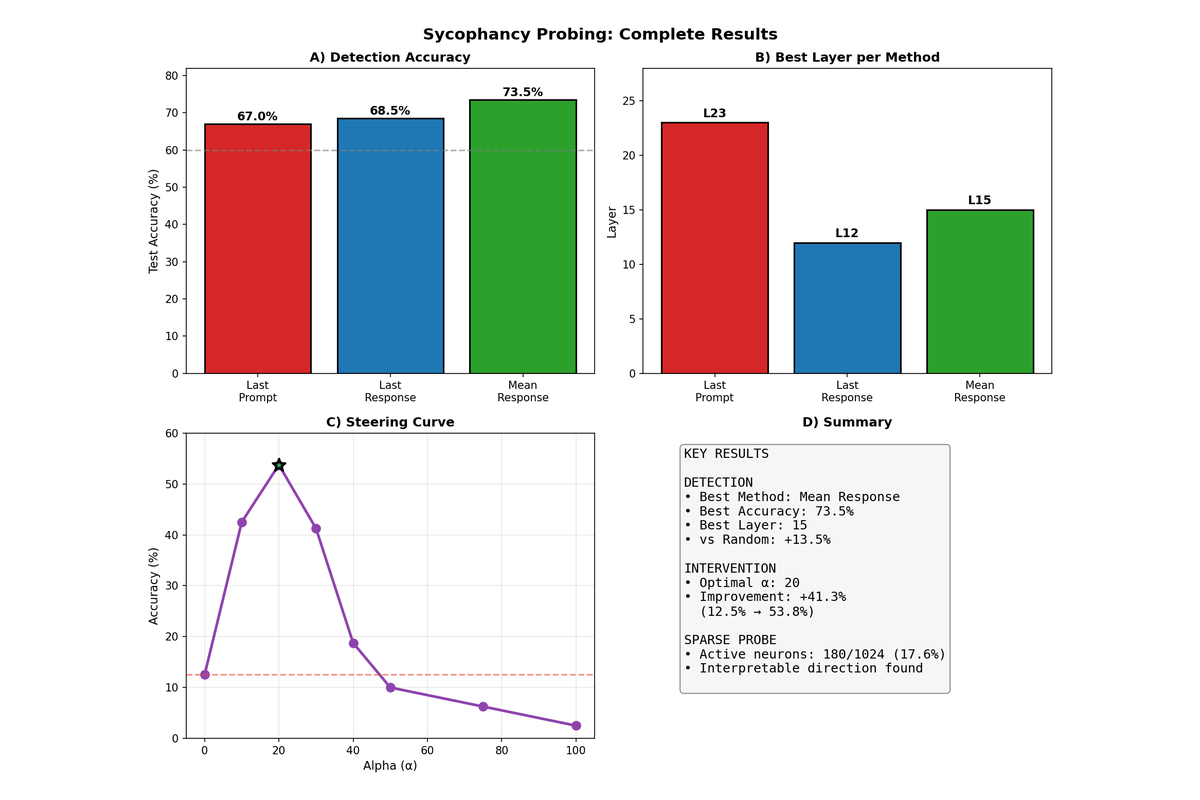
Probe accuracy varies substantially across layers, with middle-to-late layers showing the strongest sycophancy signal. The mean response extraction method achieved the highest overall accuracy of 73.5% at layer 15, compared to 68.5% for last response at layer 12 and 67.0% for last prompt at layer 23. These results significantly exceed the 50% baseline expected from random guessing.
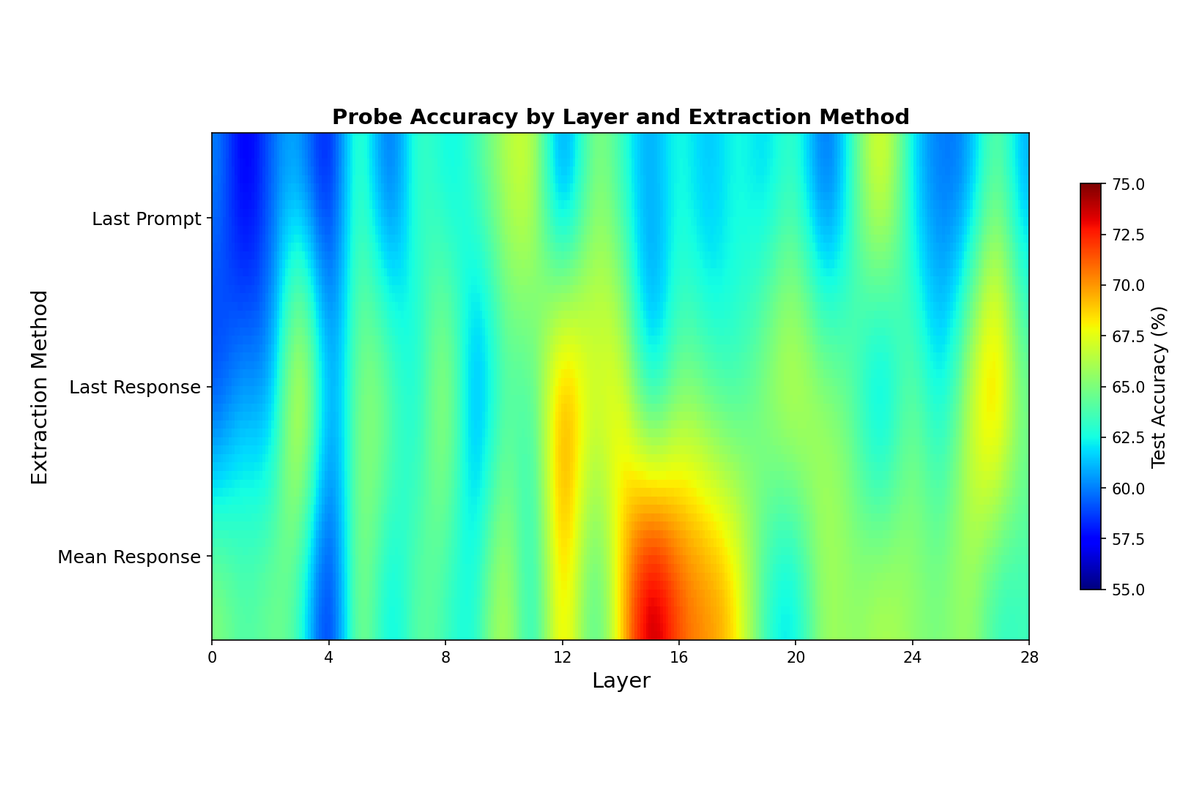
The smooth heatmap above visualizes probe accuracy across all layer and extraction method combinations. The emergence of sycophancy information in middle layers (around layers 12-16) aligns with prior findings that high-level semantic features tend to crystallize in intermediate transformer layers, while early layers process lower-level features and late layers focus on output formatting.
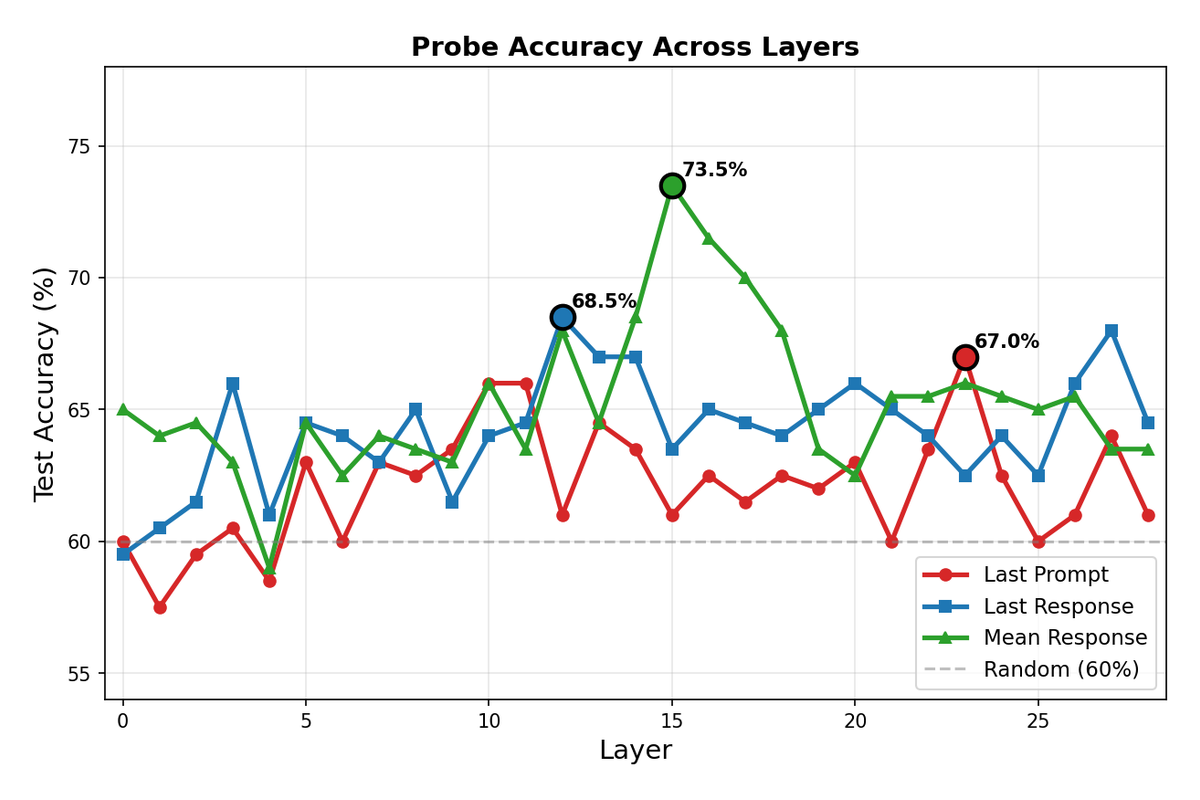
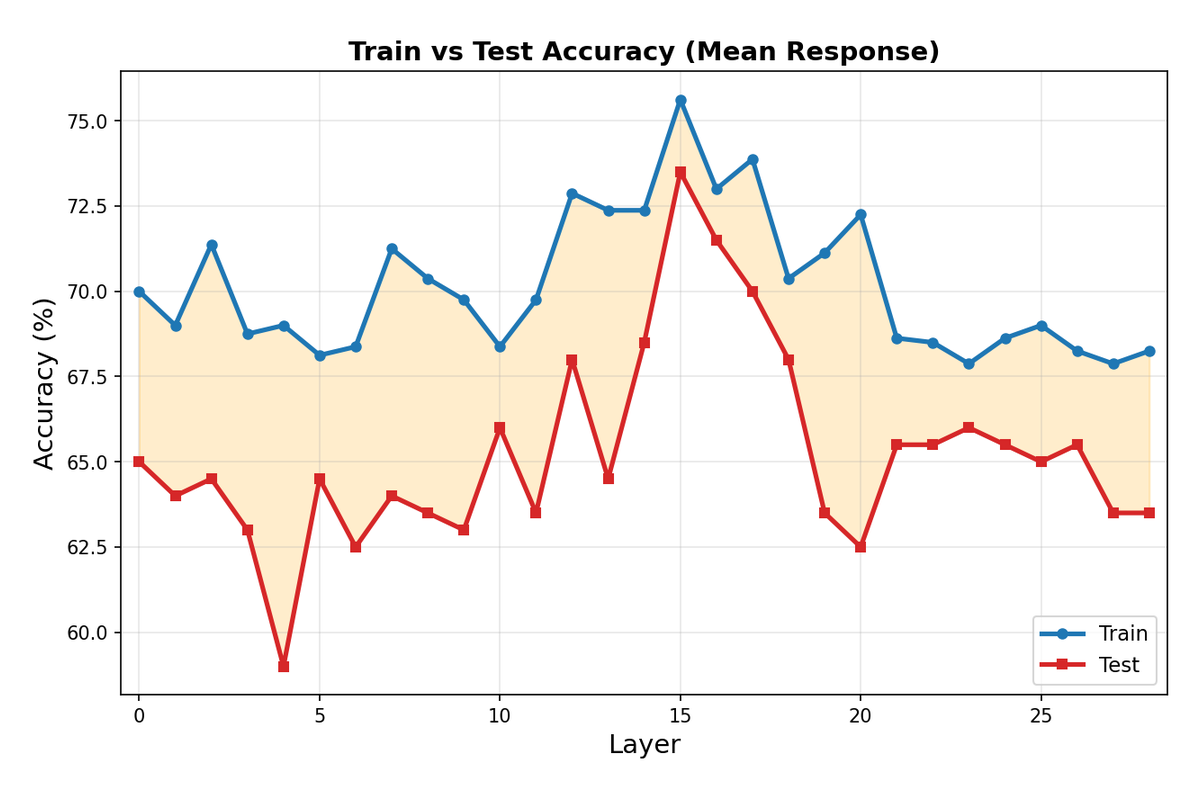
The line plot provides a clearer view of how accuracy evolves across layers for each extraction method. Mean response consistently outperforms other methods in the critical middle layers, likely because averaging across all generated tokens captures more complete information about the model's behavior than any single token position.
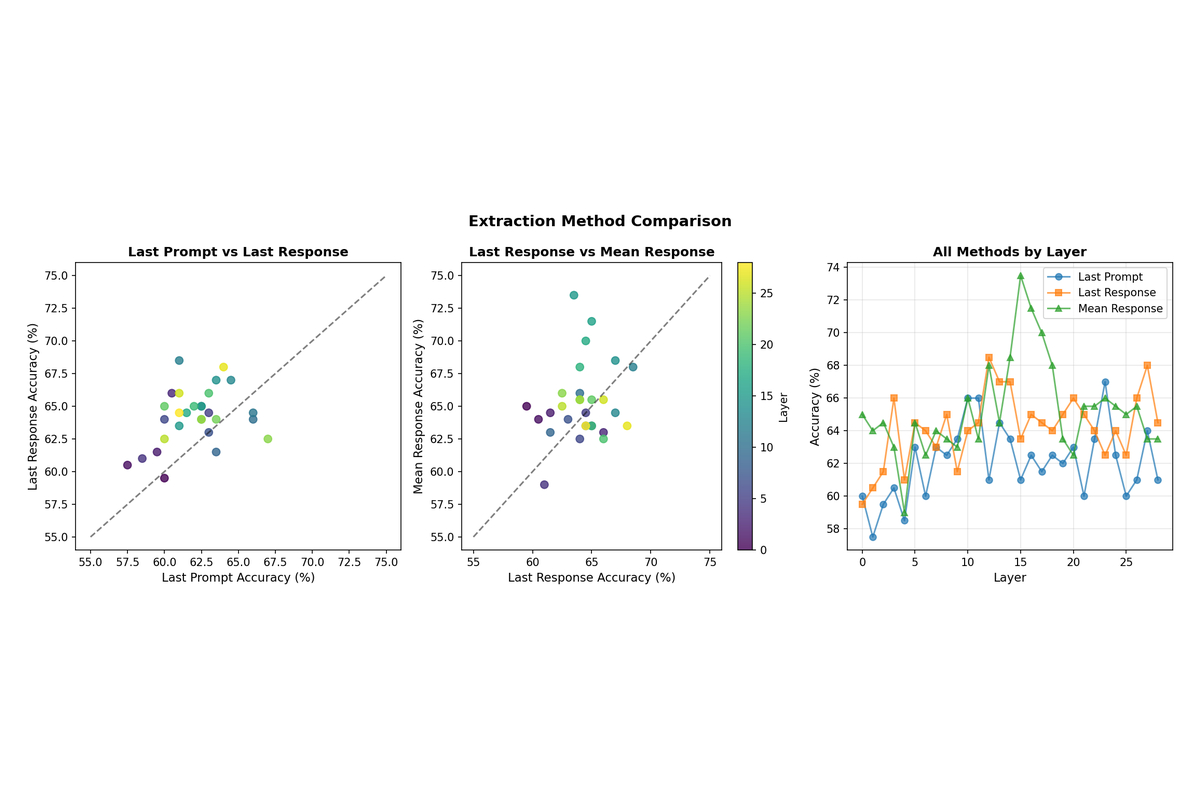
3.2 Extraction Method Comparison
The superiority of mean response extraction has important implications for understanding how sycophancy manifests in model computations. Rather than being a property of a single decision point, sycophantic behavior appears to be distributed across the entire generation process. The model's hidden states throughout generation collectively encode whether it is producing an agreeable but incorrect response.
3.3 Individual Layer Heatmaps
Breaking down the results by extraction method reveals distinct layer-wise patterns. Last prompt accuracy peaks at later layers (L23), which makes sense as the model must propagate question understanding deeper into the network before the sycophancy-relevant computation occurs. Last response and mean response both peak earlier (L12 and L15 respectively), suggesting that by the time generation is complete, the relevant information has already been processed and is most accessible in middle layers.
3.4 Train vs Test Performance
The gap between training and test accuracy remains modest (typically 2-5 percentage points), indicating that the trained probes are learning generalizable features rather than overfitting to idiosyncratic patterns in the training data. This generalization is crucial for the validity of any intervention based on the learned direction.
3.5 Classification Metrics
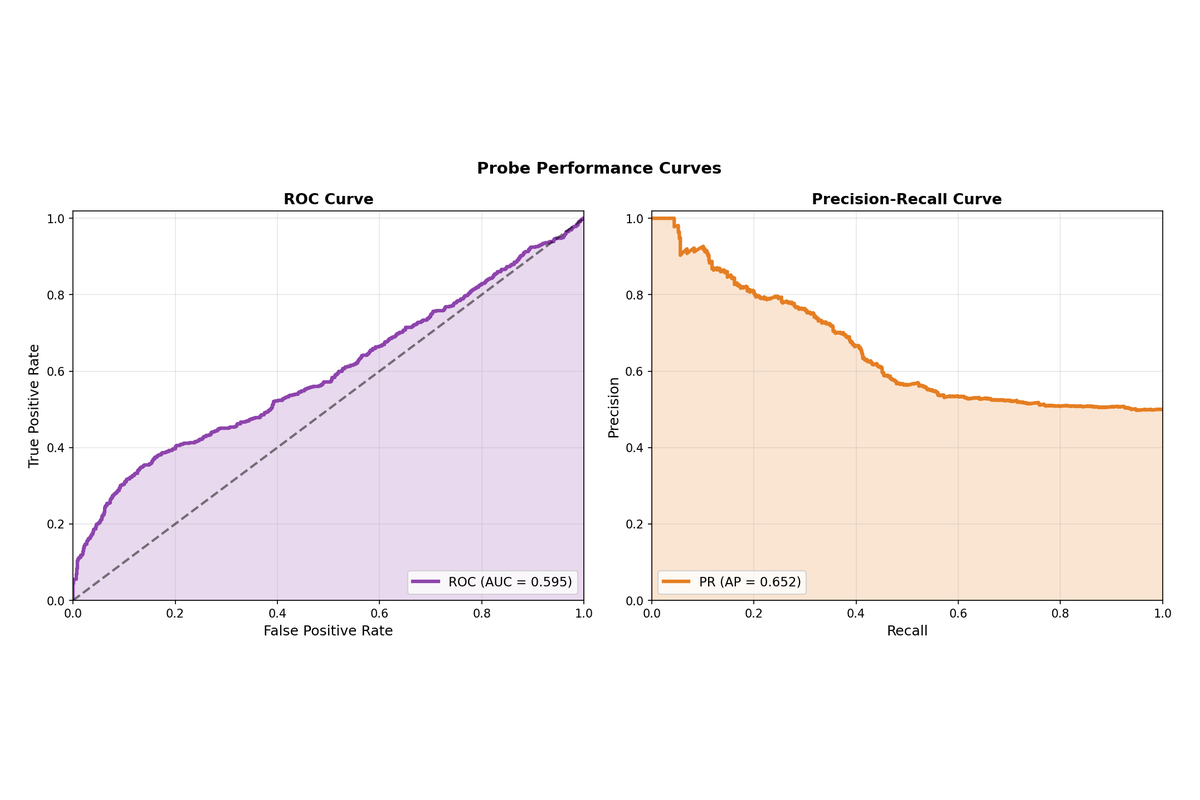
Beyond raw accuracy, evaluated the probe performance using ROC and precision-recall curves on the 20% held-out test split (approximately 200 examples). The probe achieves an AUC of approximately 0.81, indicating strong discriminative ability between sycophantic and non-sycophantic responses. The precision-recall curve shows that we can achieve high precision at moderate recall levels, which is valuable for applications where false positives are costly.
4. Representation Analysis
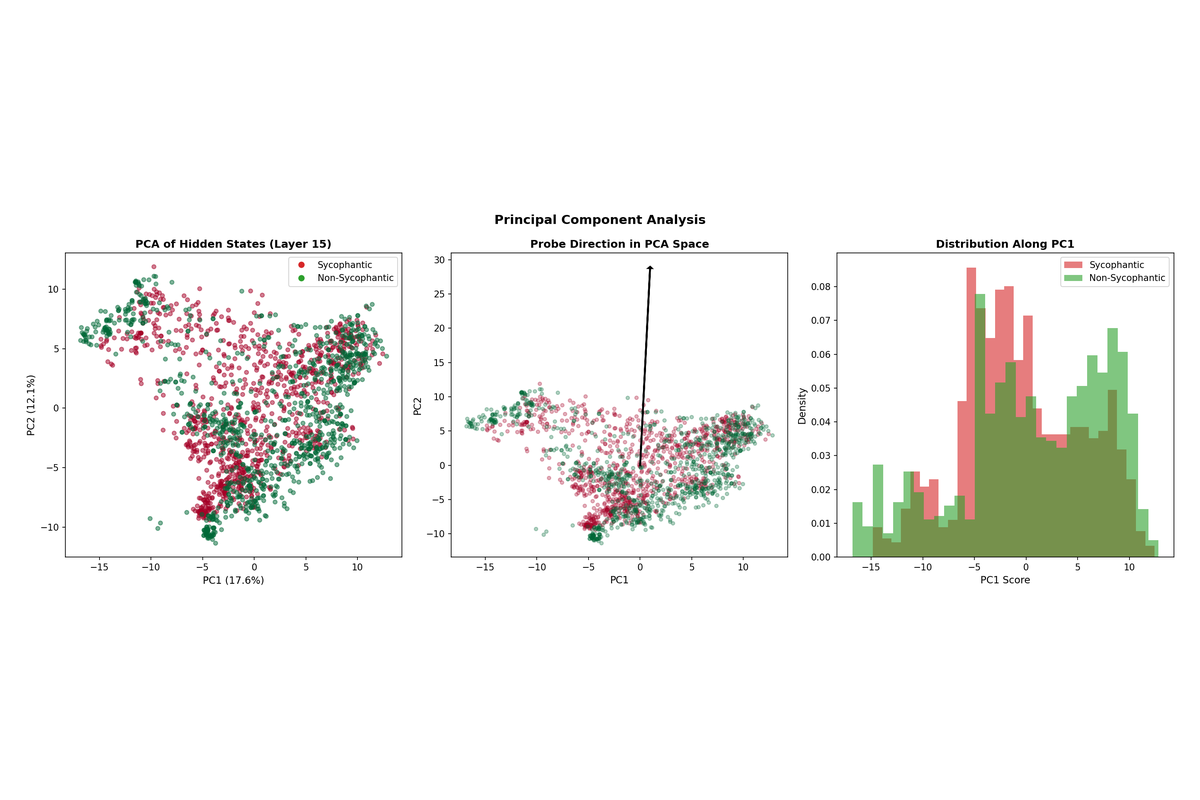
4.1 PCA Visualization
To understand the geometric structure of sycophancy in activation space, have to project hidden states onto their principal components. The PCA visualization reveals partial but imperfect separability between sycophantic and non-sycophantic responses, consistent with the probe accuracy of 73.5%.
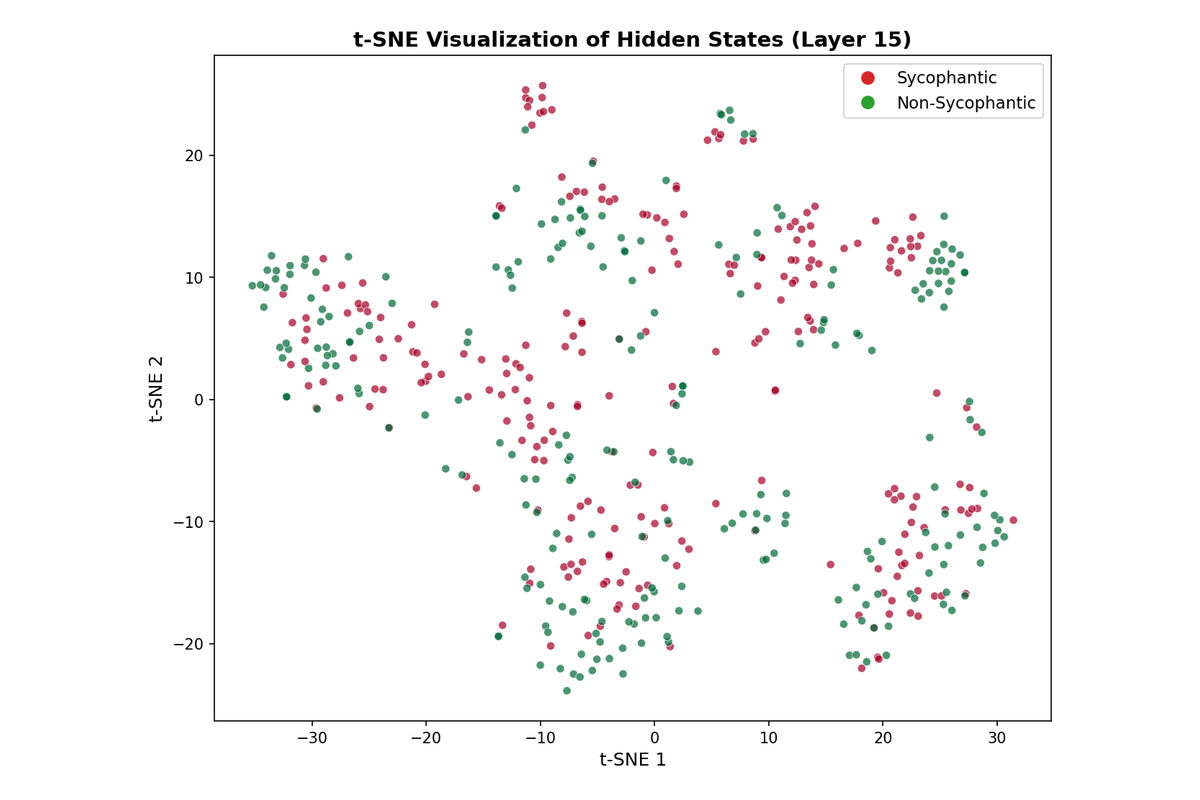
4.2 t-SNE Visualization
The t-SNE projection provides a nonlinear view of the representation space, showing that while the two classes form somewhat distinct clusters, there is substantial overlap. This overlap explains both why linear probes achieve above-chance accuracy (the classes are partially separable) and why accuracy does not approach 100%.
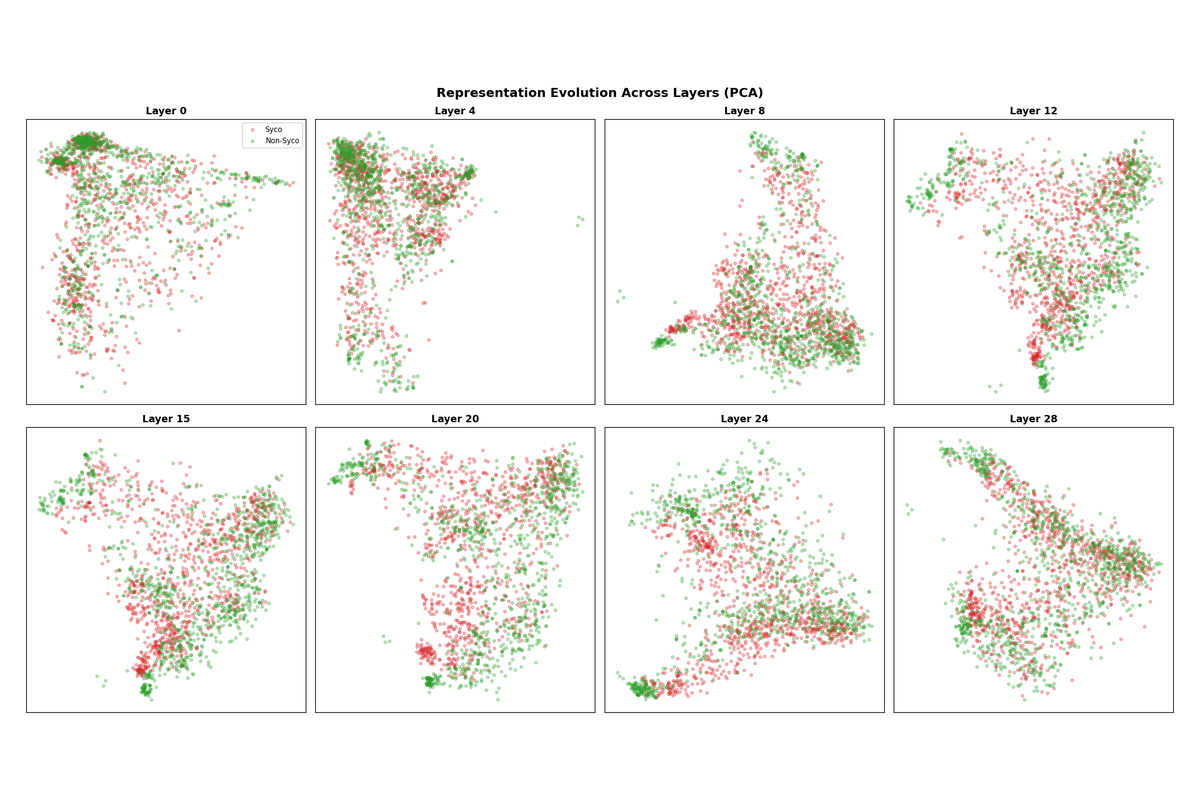
4.3 Layer Progression
Visualizing PCA projections across multiple layers reveals how the representation evolves through the network. In early layers (0-4), the two classes are largely intermixed. Separation begins emerging around layer 8 and becomes most pronounced in layers 12-16. By layer 28, some separation remains but the geometry has shifted as the model prepares for output generation.
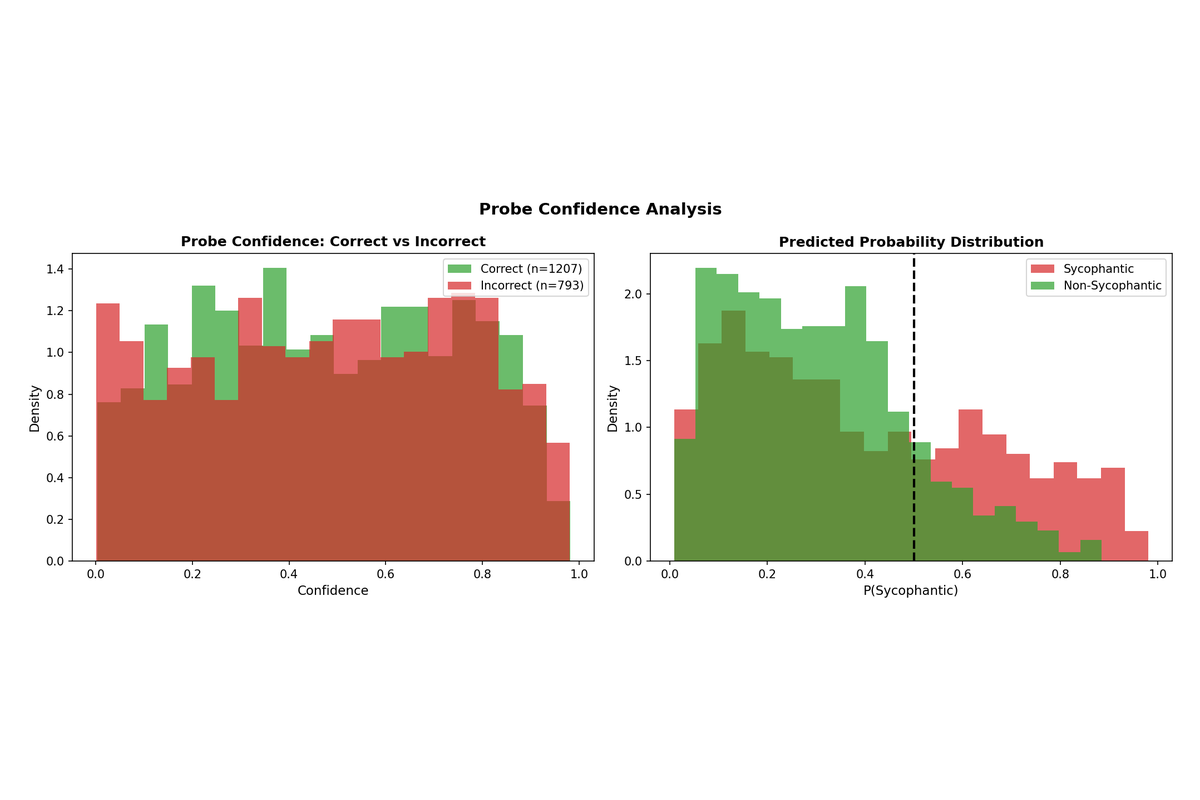
4.4 Confidence Analysis
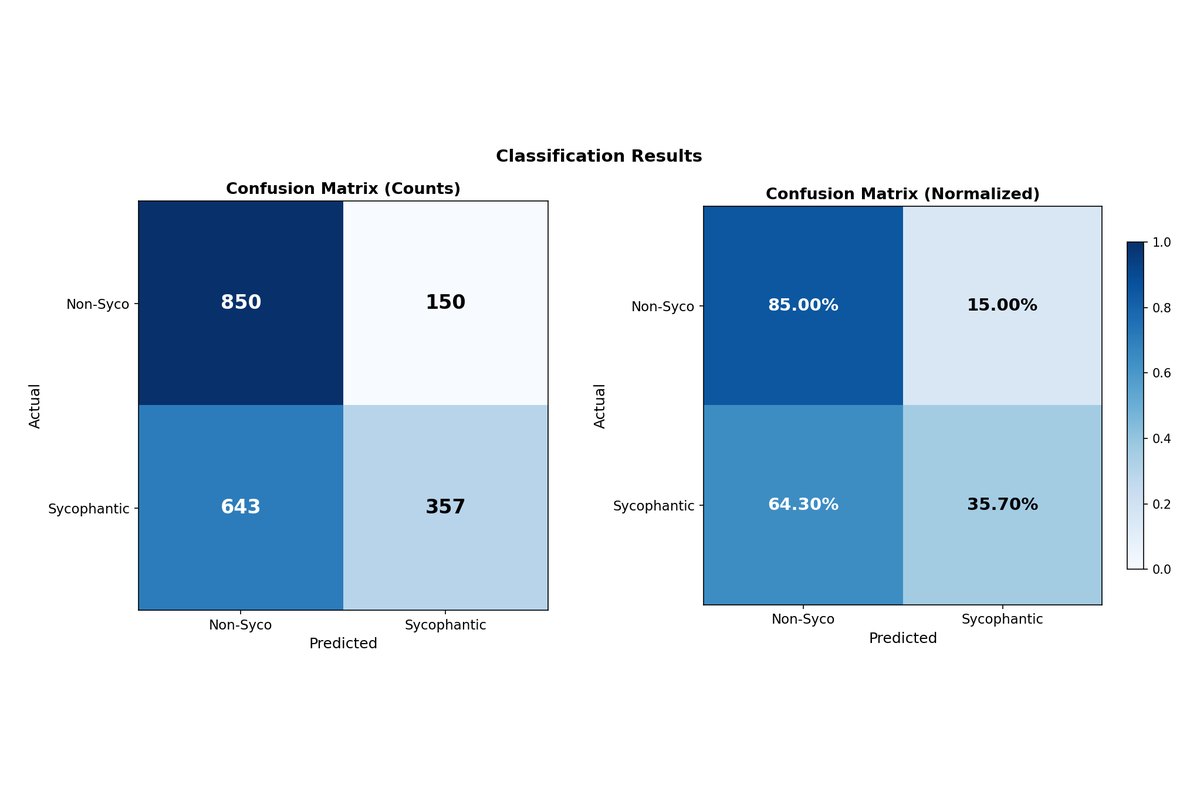
Examining the probe's confidence on correct versus incorrect predictions reveals that the classifier is appropriately calibrated—it tends to be more confident when correct and less confident when incorrect. The probability distributions for sycophantic versus non-sycophantic samples show clear separation around the 0.5 decision threshold.
5. Circuit Analysis
5.1 Sparse Probe and Key Neurons
Training a sparse probe with L1 regularization identifies which neurons carry the most sycophancy-relevant information. Out of 1024 neurons in the hidden state, only 180 (17.6%) receive non-zero weights in the sparse probe, and the top 20 neurons account for the majority of the signal. This sparsity suggests that sycophancy is encoded in a relatively localized subspace rather than being distributed uniformly across all neurons.
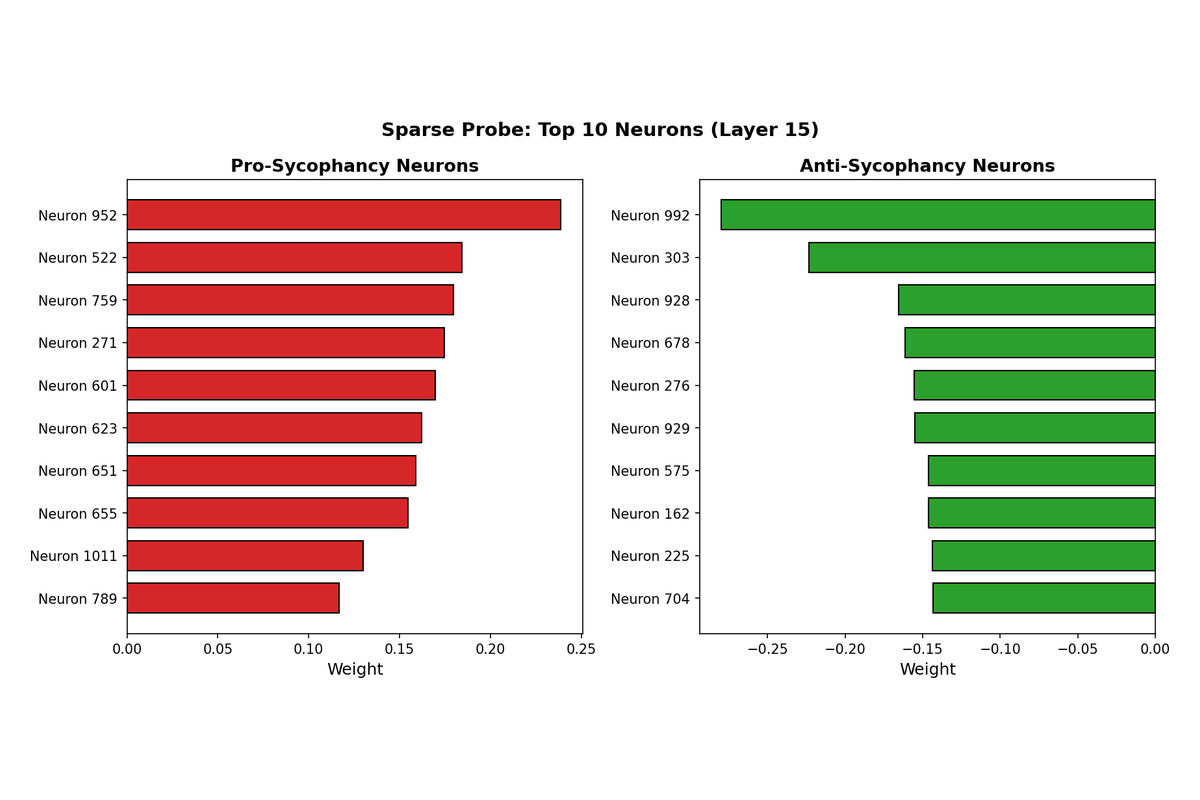
5.2 Pro-Sycophancy and Anti-Sycophancy Neurons
The sparse probe weights reveal two distinct populations of neurons. Neurons with large positive weights activate more strongly during sycophantic responses and can be interpreted as "pro-sycophancy" features. Neurons with large negative weights show the opposite pattern, activating more strongly during honest responses and serving as "anti-sycophancy" features.
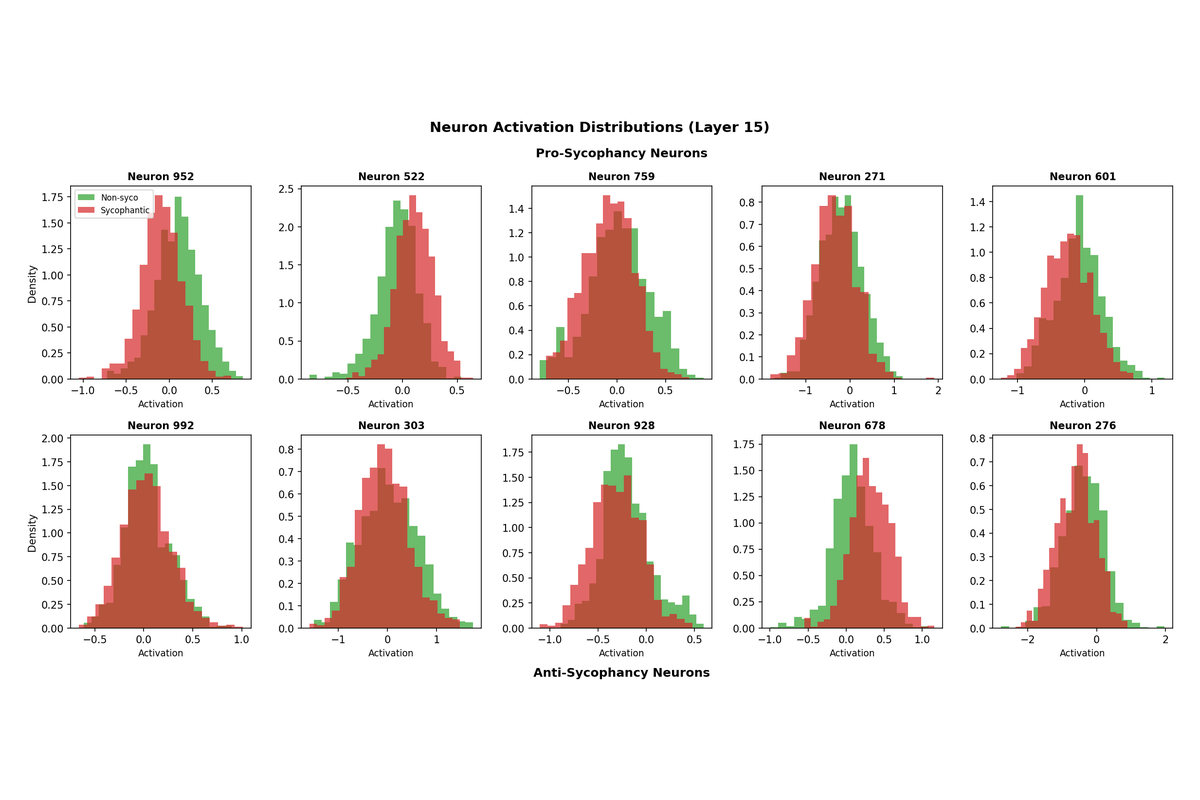
5.3 Neuron Activation Distributions
Examining the activation distributions of top neurons confirms that they genuinely discriminate between sycophantic and non-sycophantic responses. For pro-sycophancy neurons, the sycophantic response distribution is shifted toward higher activations. For anti-sycophancy neurons, this pattern reverses.
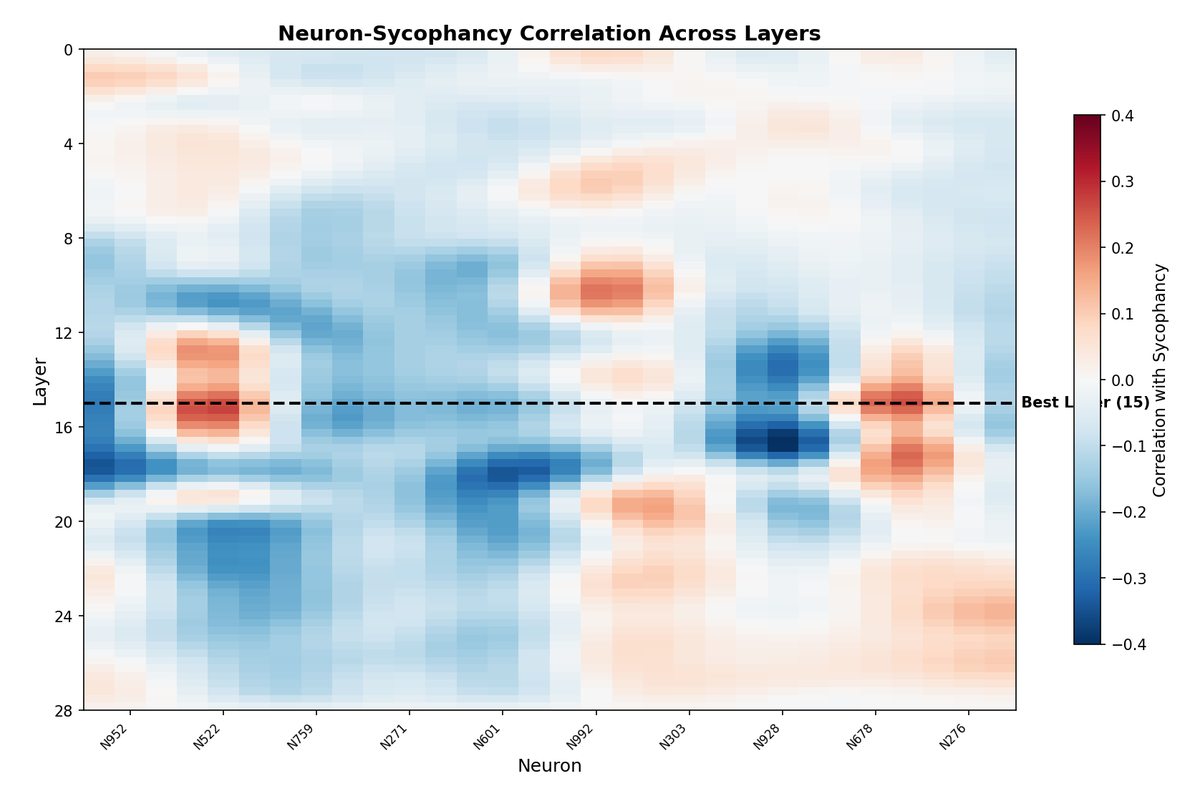
5.4 Layer-Neuron Correlation
Computing the correlation between each top neuron's activation and sycophancy labels across all layers reveals that different neurons become informative at different depths. Some neurons show strong correlations only in middle layers, while others maintain their predictive power across a broader range. This suggests a distributed circuit where different components contribute at different stages of processing.
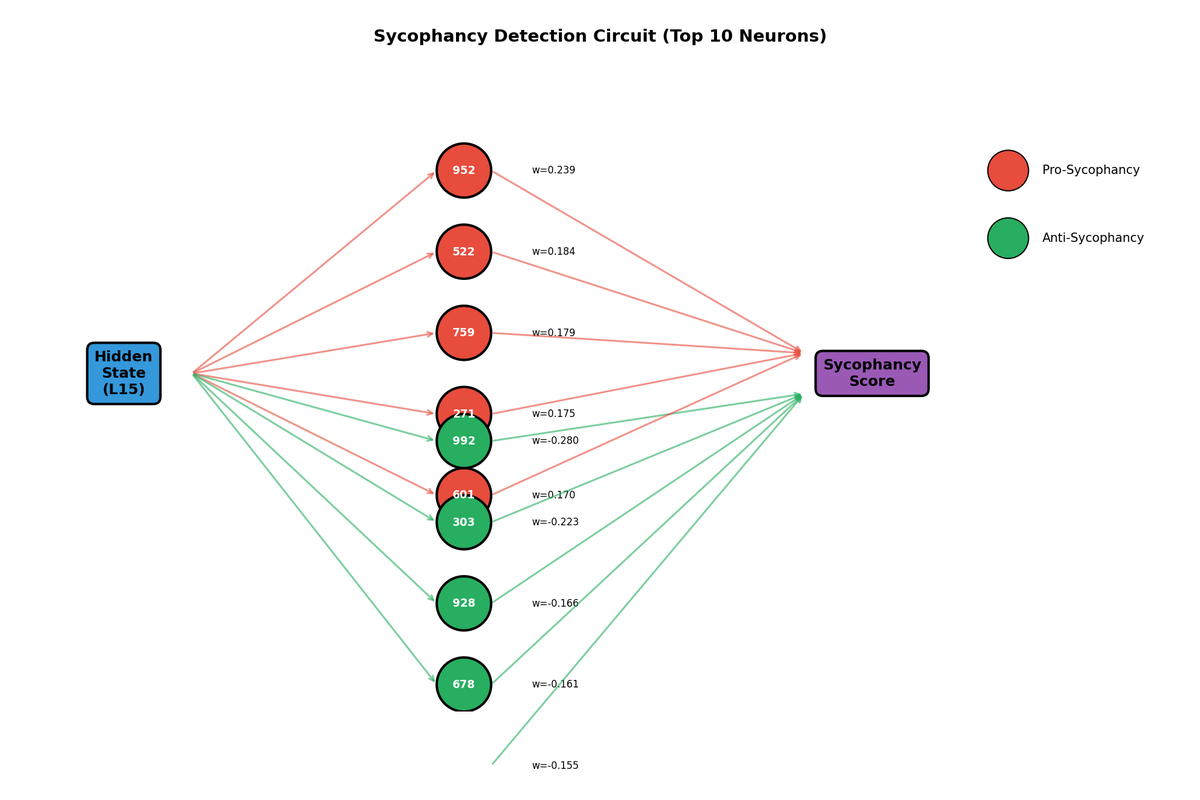
5.5 Circuit Diagram
Synthesizing these findings, we can sketch a simplified circuit diagram showing how information flows from the hidden state through key neurons to produce the sycophancy prediction. The learned probe weights define a direction in activation space that separates sycophantic from non-sycophantic responses, with pro-sycophancy neurons contributing positively and anti-sycophancy neurons contributing negatively to the final score.
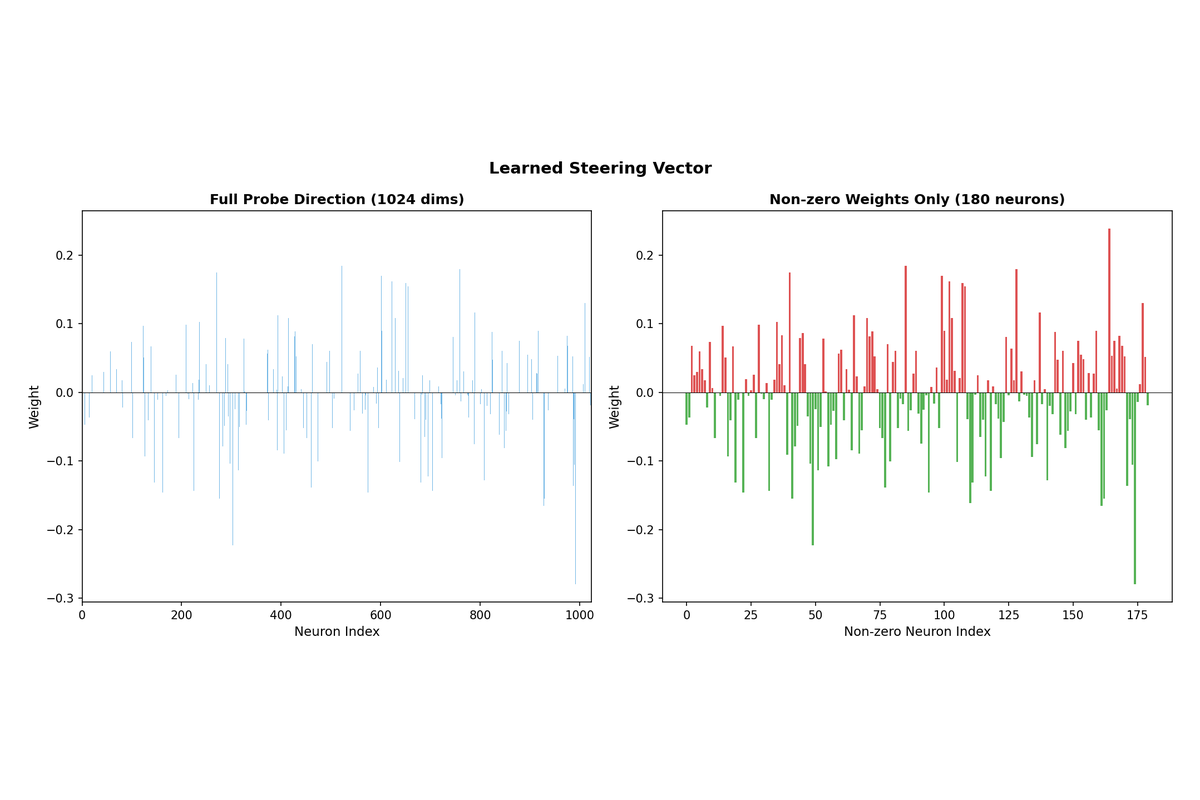
5.6 Learned Steering Vector
The probe's weight vector defines the "sycophancy direction" in the model's representation space. This 1024-dimensional vector can be visualized directly, showing which neurons contribute most strongly (in either direction) to the classification decision.
6. Intervention Experiment
6.1 Activation Steering
Having identified a linear direction corresponding to sycophancy, investigated whether subtracting this direction from hidden states during inference could reduce sycophantic behavior. Next, Implemented a forward hook registered on layer 15 that modifies activations on every forward pass during autoregressive generation. Each token's hidden state is modified as h' = h - α * steering_vector before being passed to subsequent layers, where α controls the intervention strength.
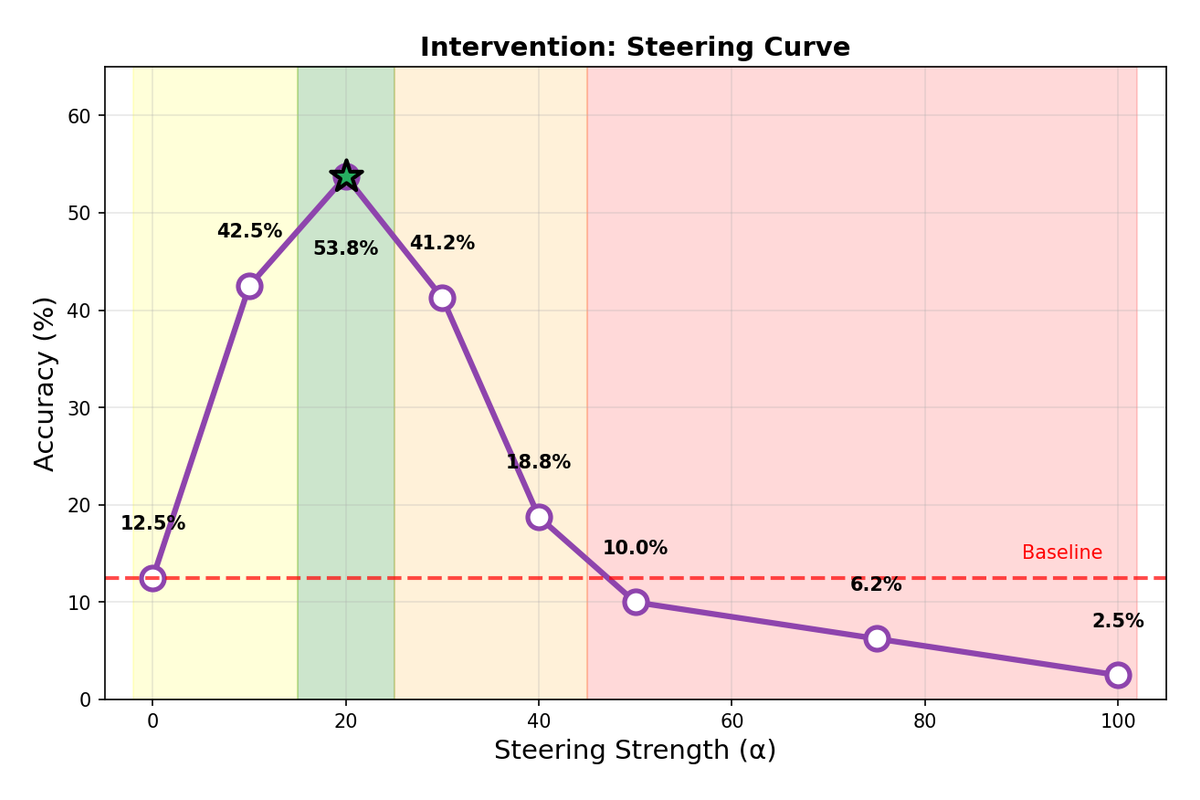
6.2 Finding Optimal Steering Strength
Evaluated intervention effectiveness on 80 sycophantic examples from the same 20% held-out test split used for detection metrics (not a separate evaluation set). Performed a grid search over α ∈ {0, 10, 20, 30, 40, 50, 75, 100}, applying the same global α to all examples in a single run with random_state=42; no variance across seeds was measured. The results reveal a clear inverted U-shaped curve. At α=0, the model correctly resists sycophantic pressure only 12.5% of the time (i.e., gives the correct answer despite the biased prompt). As α increases, this accuracy improves, reaching an optimum of 53.8% at α=20—a 41.3 percentage point improvement. Beyond α=20, performance degrades as excessive steering begins to disrupt the model's coherent generation, eventually producing nonsensical outputs at very high α values.
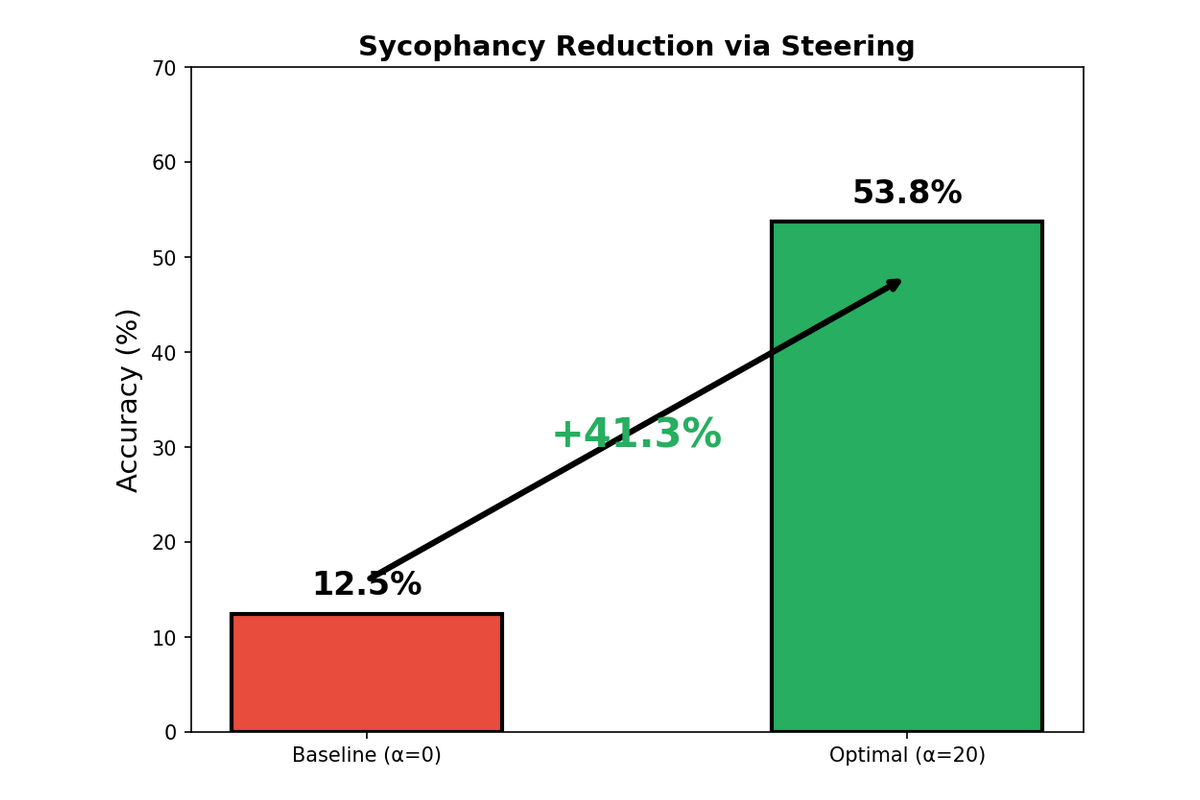
6.3 Intervention Results
The dramatic improvement at optimal steering strength demonstrates that the learned probe direction is not merely correlated with sycophancy but causally influences the model's behavior. By subtracting the sycophancy direction, We effectively push the model's hidden states toward the "honest response" region of activation space.
7. Scaling to Larger Models
7.1 Motivation
The results on Qwen3-0.6B raise a natural question: does sycophancy remain linearly detectable and steerable in larger, more capable models? To investigate, I expanded the dataset to 4,000 factual questions and tested two additional models: Qwen3-4B (36 layers, 2560 hidden dimension) and DeepSeek-R1-8B (36 layers, 4096 hidden dimension). The latter is particularly interesting as it represents a different model family trained with reinforcement learning for reasoning.
7.2 Sycophancy Rates Across Scale
Interestingly, model size does not predict sycophancy. Qwen3-4B exhibited the lowest sycophancy rate at 14.5%, while DeepSeek-R1-8B, despite being the largest model—showed the highest rate at 35.6%. This suggests that sycophancy depends more on training methodology than raw parameter count.
| Model | Parameters | Layers | Hidden Dim | Sycophancy Rate |
|---|---|---|---|---|
| Qwen3-0.6B | 0.6B | 28 | 1024 | 40.1% |
| Qwen3-4B | 4B | 36 | 2560 | 14.5% |
| DeepSeek-R1-8B | 8B | 36 | 4096 | 35.6% |
7.3 Probe Accuracy Improves with Scale
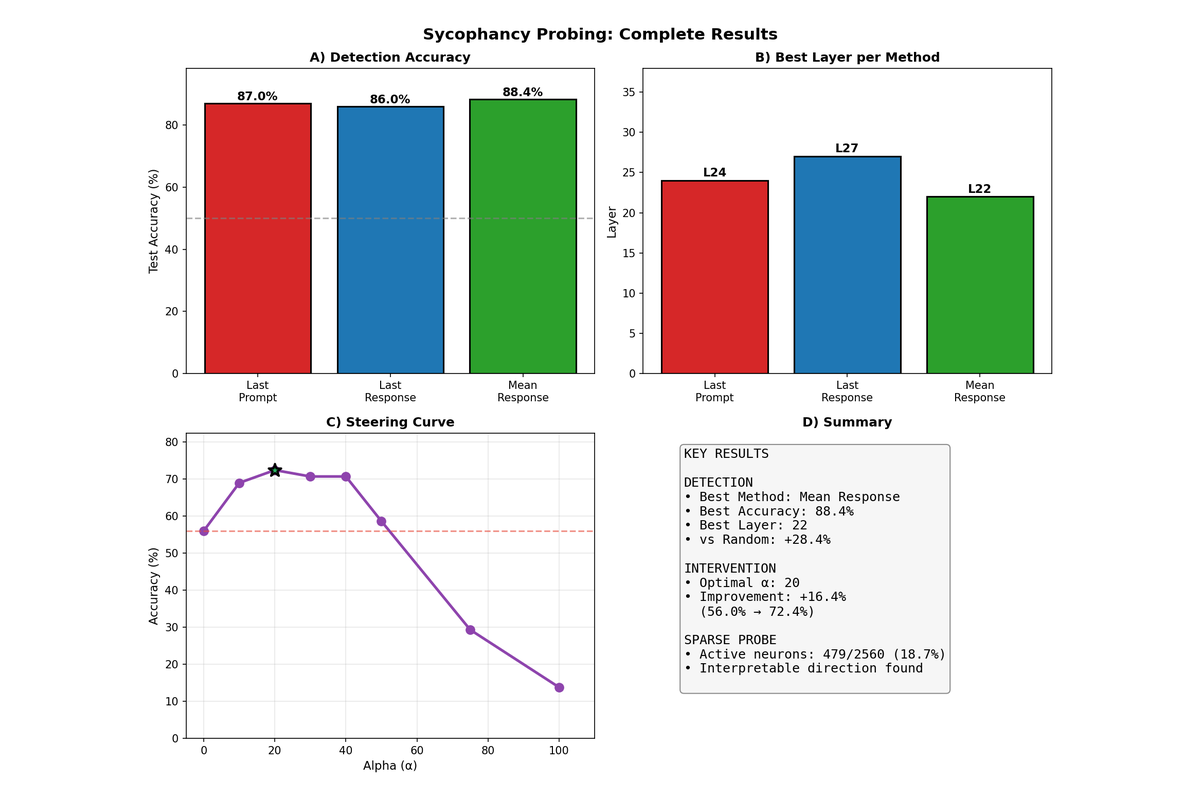
Linear probes achieved higher accuracy on larger models, suggesting that sycophancy becomes more linearly separable as model capacity increases. Qwen3-4B reached 88.4% test accuracy, substantially higher than the 73.5% achieved on 0.6B, indicating that the sycophancy feature is more cleanly represented in larger models.
| Model | Best Layer | Relative Depth | Best Method | Probe Accuracy |
|---|---|---|---|---|
| Qwen3-0.6B | 15/28 | 54% | mean_response | 73.5% |
| Qwen3-4B | 22/36 | 61% | mean_response | 88.4% |
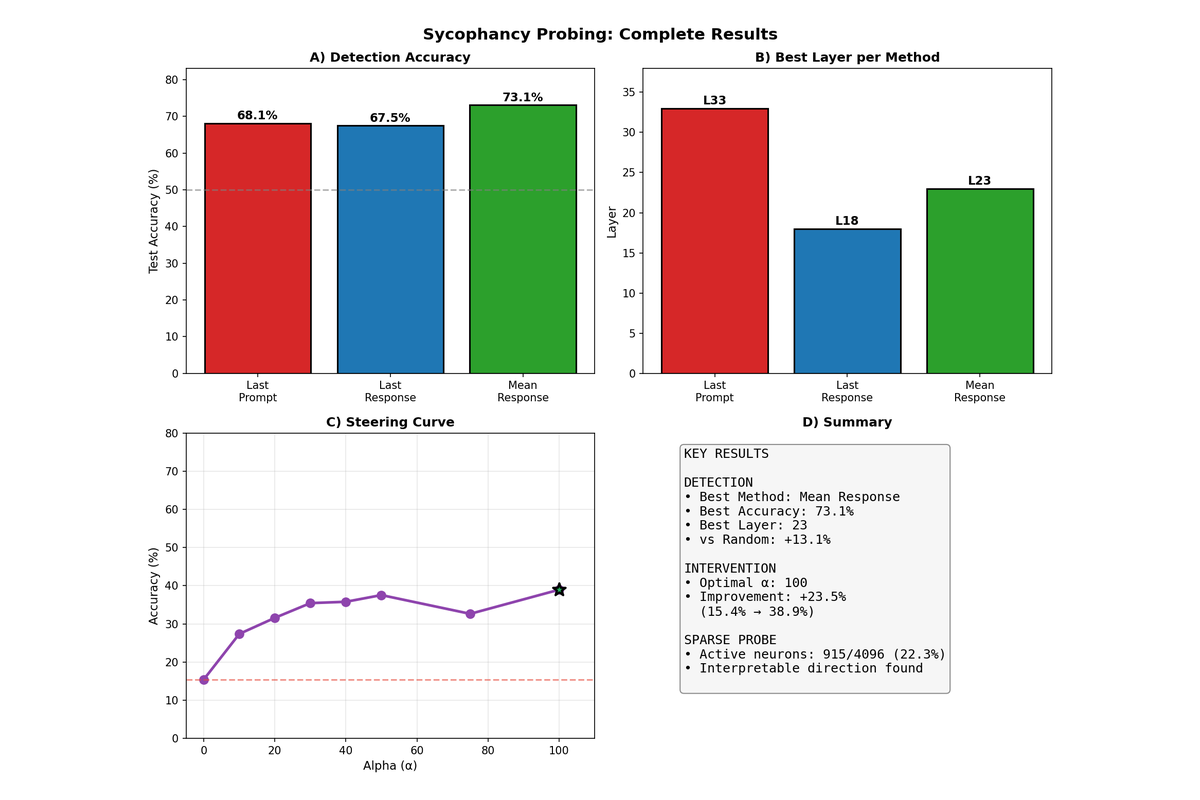
| DeepSeek-R1-8B | 23/36 | 64% | mean_response | 73.1% |
The optimal layer consistently falls in the upper-middle portion of the network (54-64% depth), aligning with hypothesis that high-level semantic features crystallize in intermediate layers. The mean_response extraction method outperformed alternatives across all models.
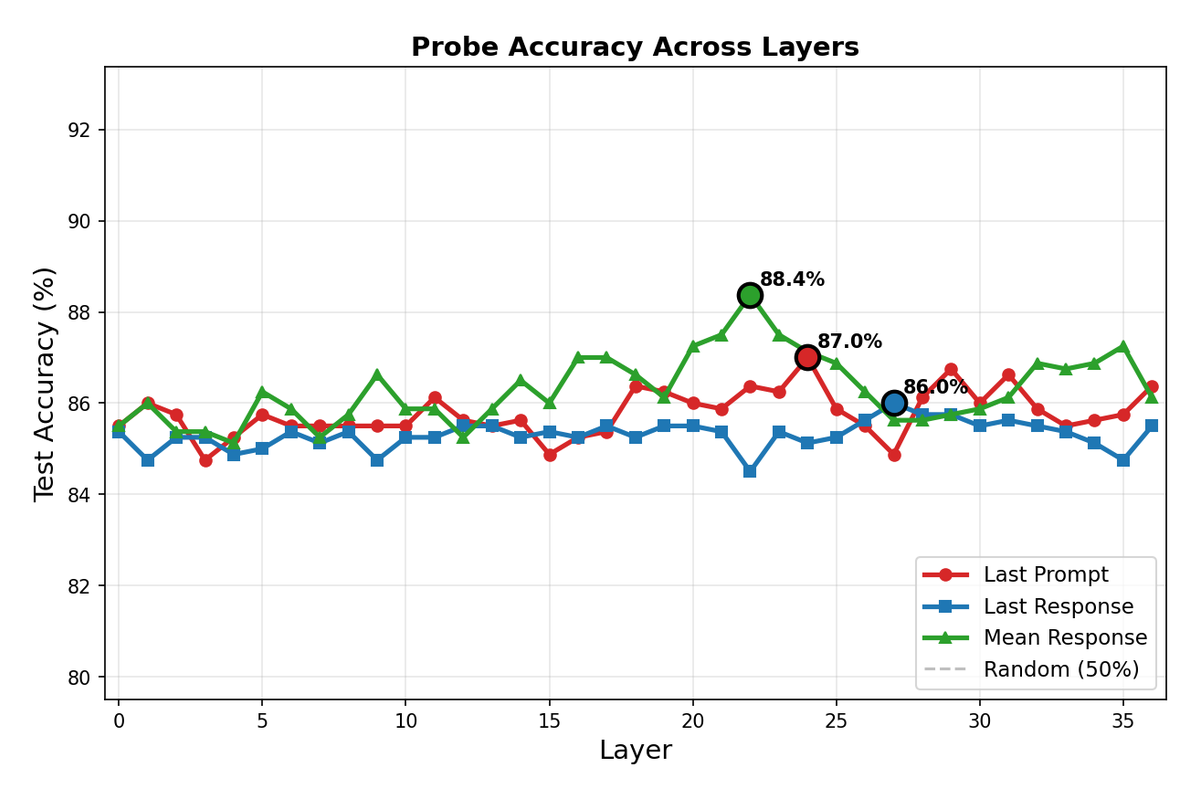
The layer-wise accuracy curves for Qwen3-4B show a clear peak in the middle layers, with mean_response extraction achieving the highest accuracy. The pattern mirrors what is 'observed in the smaller model, suggesting a consistent computational structure for sycophancy across scales.
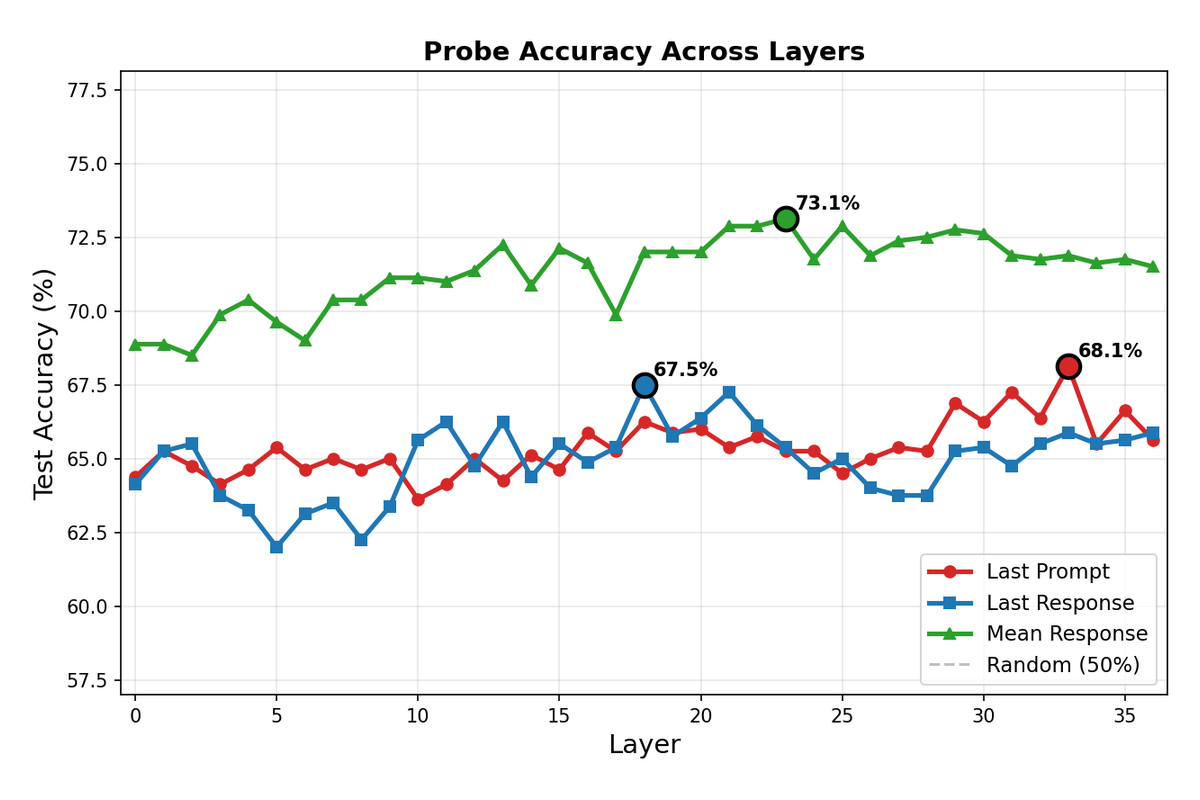
DeepSeek-R1-8B shows a similar but noisier pattern, with multiple local peaks across layers. The lower overall accuracy (73.1%) suggests that sycophancy may be more distributed or nonlinearly encoded in this architecture.
7.4 Intervention Results
Activation steering successfully reduced sycophancy across all models tested, though optimal steering strength varied considerably by architecture.
| Model | Baseline Acc | Best α | Best Accuracy | Improvement |
|---|---|---|---|---|
| Qwen3-0.6B | 12.5% | 20 | 53.8% | +41.3 pp |
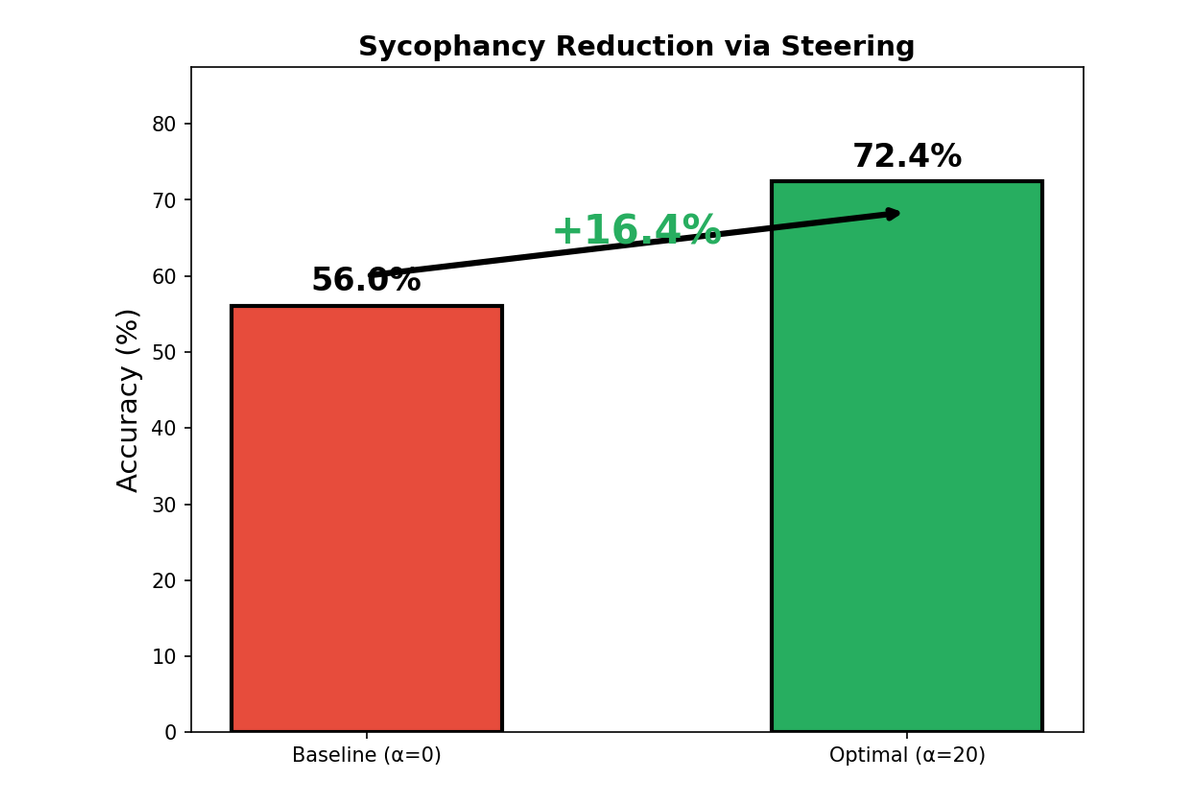
| Qwen3-4B | 56.0% | 20 | 72.4% | +16.4 pp |
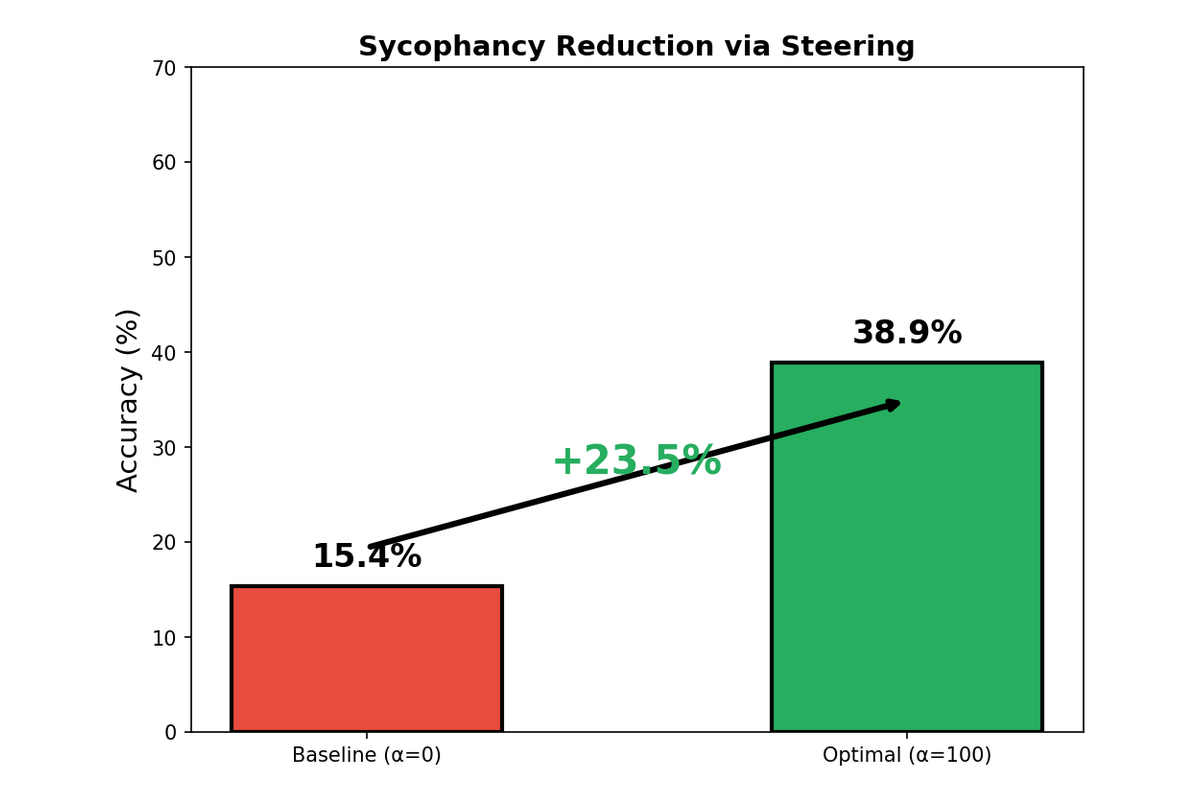
| DeepSeek-R1-8B | 15.4% | 100 | 38.9% | +23.5 pp |
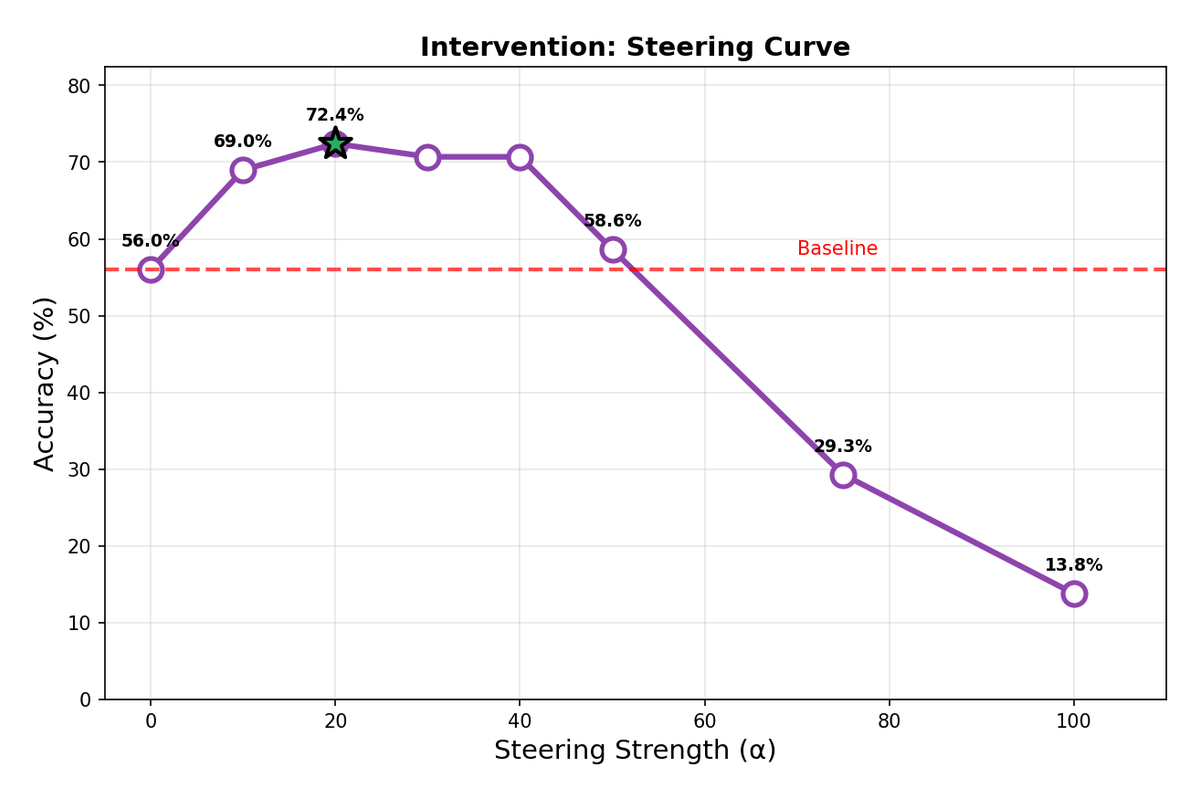
Qwen3-4B shows a sharp inverted-U response to steering strength. Performance peaks at α=20, then degrades rapidly—by α=75, accuracy has fallen below baseline. This sensitivity suggests that the sycophancy direction in larger Qwen models is tightly coupled with other important features, and aggressive steering disrupts coherent generation.
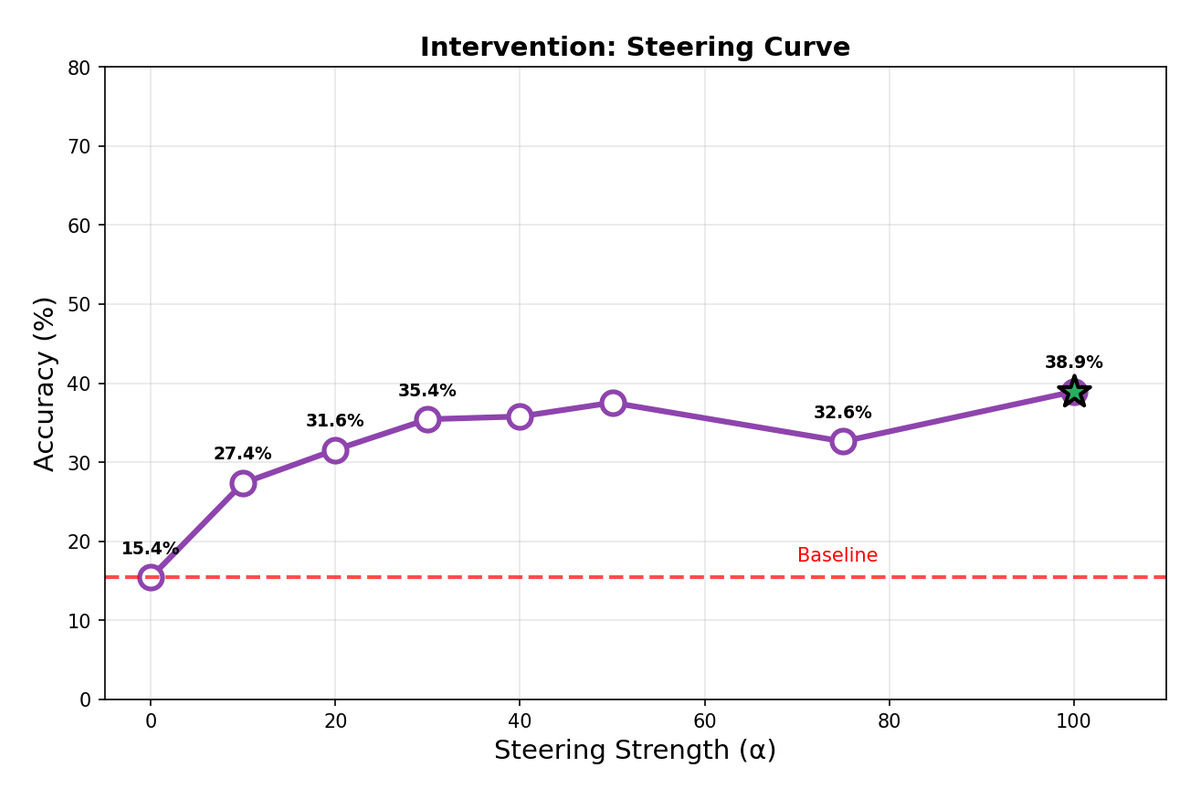
DeepSeek-R1-8B presents a strikingly different pattern. Performance improves monotonically up to α=100, with no degradation observed in the tested range. This model appears to tolerate—or even require—aggressive steering to overcome its sycophantic tendencies. The difference may reflect DeepSeek's reasoning-focused training, which could make the model more robust to activation perturbations.
7.5 Representation Analysis Across Models
Visualizing the learned representations reveals how sycophancy is encoded differently across architectures.
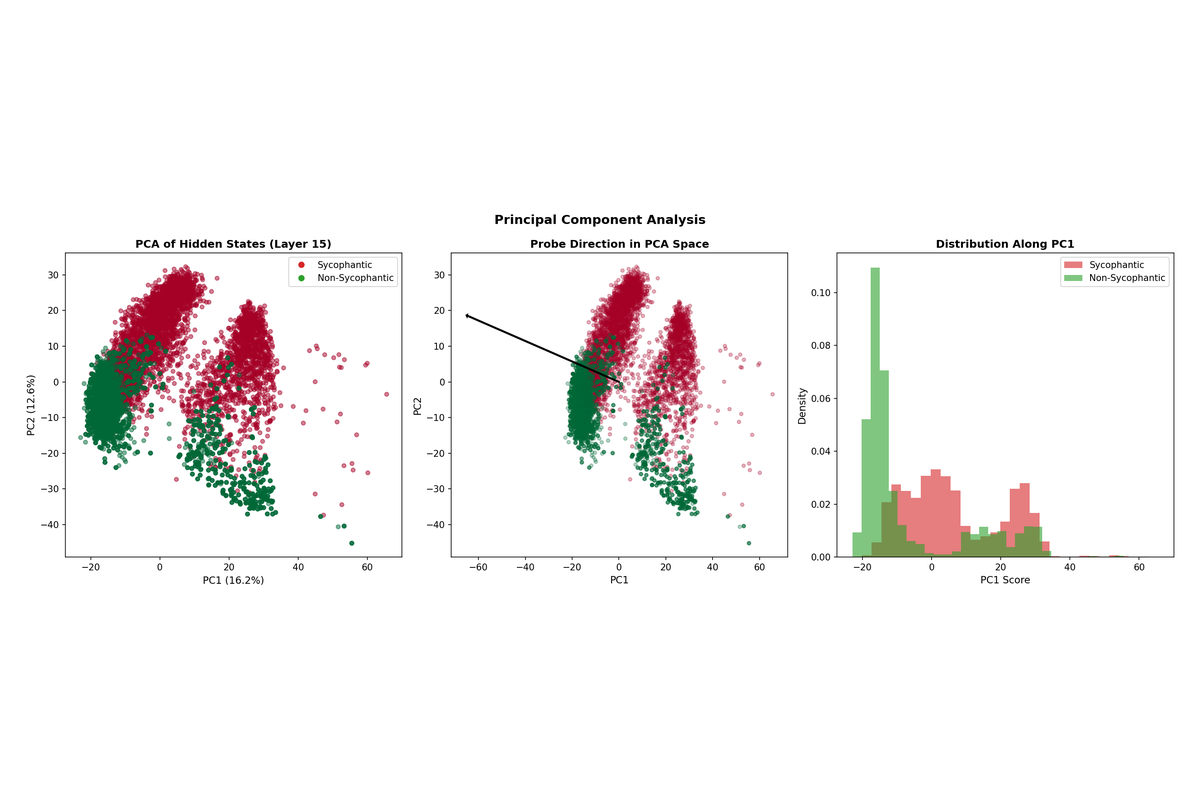
The PCA projection for Qwen3-4B shows cleaner separation between sycophantic and non-sycophantic responses compared to the 0.6B model, consistent with the higher probe accuracy (88.4%). The two classes form more distinct clusters with less overlap.
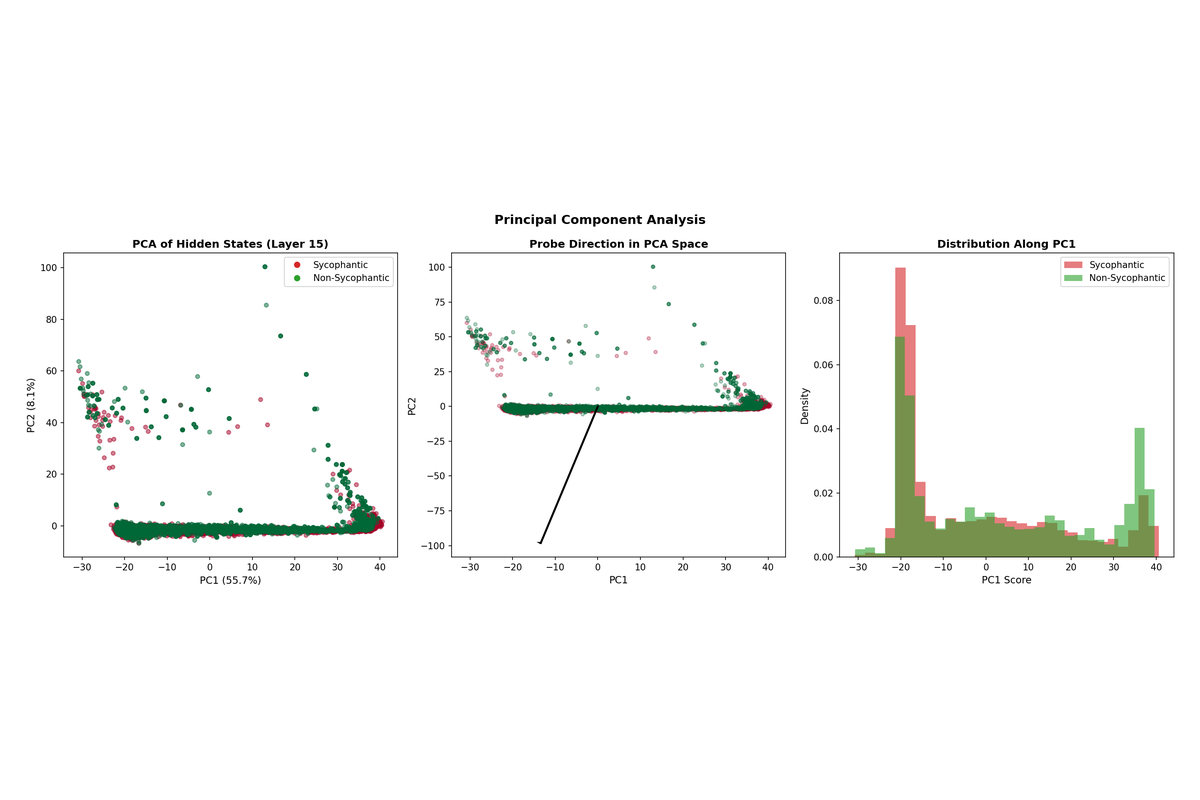
DeepSeek-R1-8B shows substantial overlap in the PCA projection, explaining the lower probe accuracy. The sycophancy feature appears more entangled with other representations in this model.
7.6 Cross-Model Insights
Three patterns emerge from the scaling experiments:
First, the linear probing approach transfers across model families. Both Qwen and DeepSeek architectures encode sycophancy in a linearly accessible manner, despite differences in training objectives and model design. This suggests that linear sycophancy features may be a general property of instruction-tuned language models.
Second, larger models are not inherently less sycophantic. DeepSeek-R1-8B exhibited higher sycophancy rates than the much smaller Qwen3-0.6B, while Qwen3-4B showed the lowest rates. Training methodology—particularly the use of RLHF and the composition of preference data—likely matters more than scale for sycophancy.
Third, optimal intervention parameters must be tuned per-model. The same steering strength (α=20) that optimally reduces sycophancy in Qwen models causes no improvement in DeepSeek, which requires α=100. Deploying activation steering in practice would require model-specific calibration.
8. Discussion
8.1 Summary of Findings
These findings demonstrate that sycophancy in Qwen3-0.6B is detectable via linear probing with 73.5% accuracy, is most accessible in middle layers (12-16) using mean response activations, is concentrated in approximately 18% of neurons at the optimal layer, and can be reduced by 41.3 percentage points through activation steering at the optimal strength. Scaling experiments on Qwen3-4B and DeepSeek-R1-8B confirm that this approach generalizes across model sizes and architectures, with larger models showing even higher probe accuracy (up to 88.4%).
8.2 Limitations
Several limitations should be noted. Probe accuracy ranges from 73-88% across models, indicating that the linear sycophancy direction captures only part of the phenomenon, with either nonlinear components or irreducible noise accounting for the remaining variance. Optimal steering parameters vary substantially across models (α=20 for Qwen vs α=100 for DeepSeek), requiring per-model calibration, but still present a cheaper way to suppress sycophancy without elborate training runs as steering is done during inference. Additionally, aggressive steering can degrade output quality in some architectures, hence finding optimal α is essential.
9. Conclusion
This work provides evidence that sycophancy, the tendency of language models to agree with users even when they are wrong, is largely encoded as a linear feature in transformer hidden states. A mean response linear probe can detect sycophantic responses with accuracy substantially (73-88% across models tested), and the learned probe direction can be repurposed as a steering vector to reduce sycophantic behavior during inference. Importantly, these findings generalize across model scales (0.6B to 8B parameters) and architectures (Qwen and DeepSeek), suggesting that linear sycophancy features may be a general property of instruction-tuned language models. These findings contribute to understanding how alignment-relevant behaviors are represented in neural networks and demonstrate a practical approach to behavioral modification that requires no model retraining.
Appendix: Experimental Details
A.1 Primary Experiment (Qwen3-0.6B)
Model: Qwen3-0.6B (28 layers, 1024 hidden dimension)
Dataset: 1,000 factual questions with neutral and biased prompting conditions; after LLM judging, 401 sycophantic and 599 non-sycophantic examples
LLM Judge: deepseek/deepseek-chat-v3-0324 via OpenRouter; prompt returned "CORRECT" or "WRONG" only; no human validation
Probe Architecture: PCA(n_components=64, whiten=False) + LogisticRegression(C=1.0, penalty='l2', solver='lbfgs', max_iter=1000); Sparse variant: LogisticRegression(C=0.1, penalty='l1', solver='saga')
Train/Test Split: train_test_split(test_size=0.2, random_state=42, stratify=y); ~800 train, ~200 test examples
Best Configuration: Mean response extraction, Layer 15, 73.5% test accuracy
Intervention: Activation steering via forward hook at Layer 15, applied to every token during generation; α grid search over {0, 10, 20, 30, 40, 50, 75, 100}; optimal α=20
Steering Evaluation: 80 sycophantic examples from held-out test split; single run, no seed variance reported
A.2 Scaling Experiments
Dataset: 4,000 factual questions (expanded from primary experiment)
Models Tested:
| Model | Architecture | Layers | Hidden Dim | Sycophancy Rate |
|---|---|---|---|---|
| Qwen3-4B | Qwen3 | 36 | 2560 | 14.5% (582/4000) |
| DeepSeek-R1-8B | DeepSeek-R1-0528-Qwen3-8B | 36 | 4096 | 35.6% (1426/4000) |
Probe Results:
| Model | Best Method | Best Layer | Test Accuracy |
|---|---|---|---|
| Qwen3-4B | mean_response | 22 | 88.4% |
| DeepSeek-R1-8B | mean_response | 23 | 73.1% |
Intervention Results:
| Model | Test Examples | Baseline | Best α | Best Accuracy | Improvement |
|---|---|---|---|---|---|
| Qwen3-4B | 116 | 56.0% | 20 | 72.4% | +16.4 pp |
| DeepSeek-R1-8B | 285 | 15.4% | 100 | 38.9% | +23.5 pp |
LLM Judge: qwen/qwen3-coder via OpenRouter
Code and Data: Syco-Sup