Spaces:
Sleeping

Sleeping
| title: "Geospatial Analysis with Excel" | |
| original_url: "https://tds.s-anand.net/#/geospatial-analysis-with-excel?id=geospatial-analysis-with-excel" | |
| downloaded_at: "2025-06-08T23:26:02.659173" | |
| [Geospatial Analysis with Excel](#/geospatial-analysis-with-excel?id=geospatial-analysis-with-excel) | |
| ---------------------------------------------------------------------------------------------------- | |
| [](https://youtu.be/49LjxNvxyVs) | |
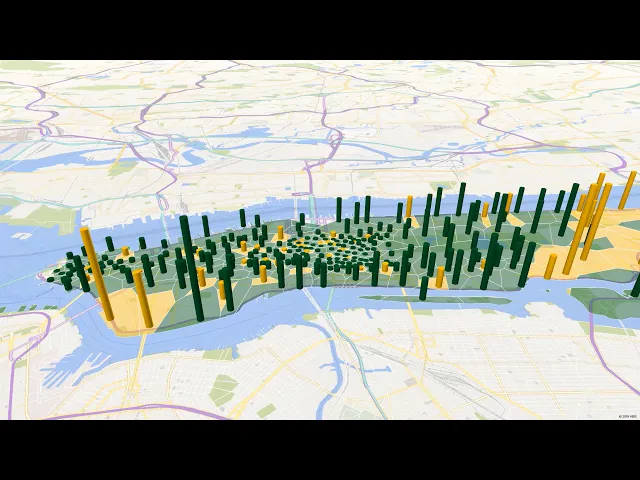
| You’ll learn how to create a data-driven story about coffee shop coverage in Manhattan, covering: | |
| * **Data Collection**: Collect and scrape data for coffee shop locations and census population from various sources. | |
| * **Data Processing**: Use Python libraries like geopandas for merging population data with geographic maps. | |
| * **Map Creation**: Generate coverage maps using tools like QGIS and Excel to visualize coffee shop distribution and population impact. | |
| * **Visualization**: Create physical, Power BI, and video visualizations to present the data effectively. | |
| * **Storytelling**: Craft a narrative around coffee shop competition, including strategic insights and potential market changes. | |
| Here are links that explain how the video was made: | |
| * [The Making of the Manhattan Coffee Kings](https://blog.gramener.com/the-making-of-manhattans-coffee-kings/) | |
| * [Shaping and merging maps](https://blog.gramener.com/shaping-and-merging-maps/) | |
| * [Visualizing data on 3D maps](https://blog.gramener.com/visualizing-data-on-3d-maps/) | |
| * [Physical and digital 3D maps](https://blog.gramener.com/physical-and-digital-3d-maps/) | |
| [Previous | |
| Data Analysis with ChatGPT](#/data-analysis-with-chatgpt) | |
| [Next | |
| Geospatial Analysis with Python](#/geospatial-analysis-with-python) |